
Business
States with the largest unionized workforces

States with the largest unionized workforces
Unions spent the first half of the 20th century transforming a massive industrial peasantry into the American middle class. In the second half of the 20th century, big business fought back by pressing for so-called “right-to-work” laws, which dilute the influence of labor unions and their power of collective bargaining.
The right-to-work campaign has been an unmitigated success for big business. Union memberships plummet wherever these laws exist, weakening the primary check on corporate excess. The results are clear: The dramatic decline in union membership that began in the early 1960s directly coincided with a meteoric rise in the share of income going to the top 10%.
To determine which states are the most unionized, Stacker looked at BLS data for 2021 (released in January 2022) and ranked each state according to its percentage of wage and salary workers who were members of labor unions.
Not surprisingly, the issue is politically polarized. Republicans overwhelmingly back right-to-work laws, and Democrats overwhelmingly side with their historic allies in labor. In fact, a red/blue map of the right-to-work states versus pro-union states looks nearly identical to that of the Electoral College.
Today, 27 states enforce right-to-work laws. These free-rider statutes extend the gains of union-won collective bargaining agreements to non-union workers who didn’t join or pay dues themselves. Predictably and as intended, many workers simply opt to piggyback instead of pitching in, which causes union membership and the influence of organized labor to dwindle. Big business prefers divided labor over organized labor for a reason. According to the Bureau of Labor Statistics (BLS), the median weekly wage for union members in the United States is $1,169 vs. $975 for nonunion workers.
In 2021, union membership stood at about 10.3% of the U.S. workforce. That’s a little more than half of the 20.1% that existed when BLS began tracking it in 1983. Three decades before that, in 1953, more than one in three private-sector workers were union members. Today, that number has dwindled to just 6.1%. Right-to-work legislation is decided at the state level, so the country’s remaining union members are not spread out evenly.
Keep reading to see which states are the most unionized.
You may also like: Can you answer these real ‘Jeopardy!’ questions about the economy?
![]()
Khanrak // Wikimedia Commons
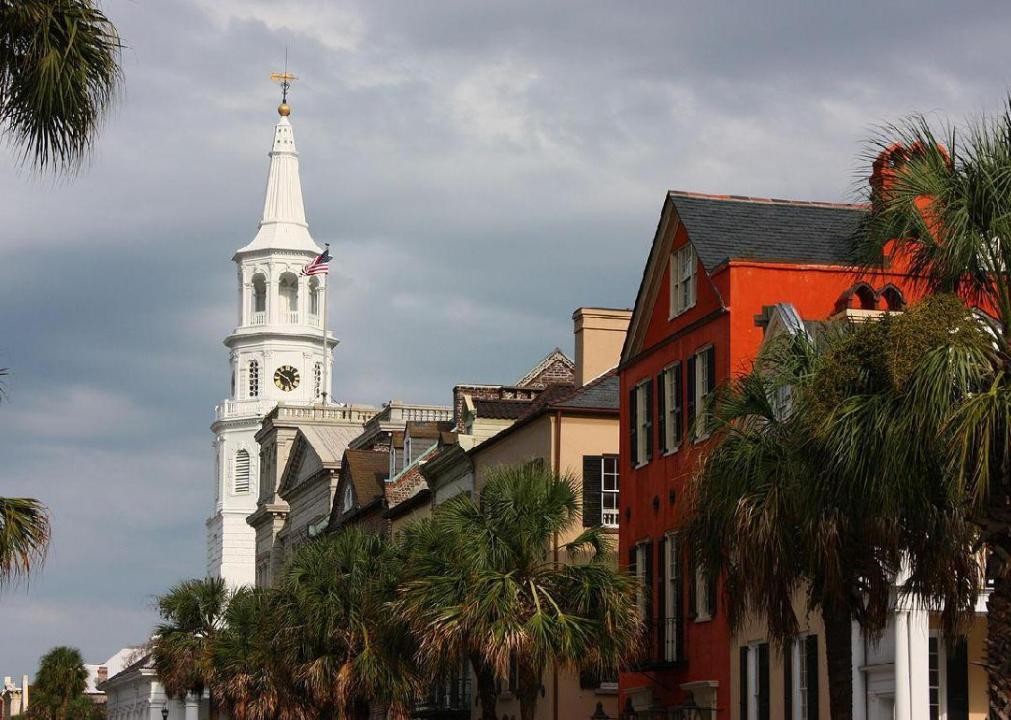
#51. South Carolina
– Members of unions: 34,000 (1.7% of employed population)
— Down 25,000 from 2020 (-1.2 percentage points)
– Workers represented by unions: 42,000 (2% of employed population)
— Down 35,000 from 2020 (-1.8 percentage points)
No stranger to the bottom of the list, South Carolina once again takes the title of America’s least unionized state. The state’s workforce is growing quickly, while union membership has declined.

James Willamor // Flickr
#50. North Carolina
– Members of unions: 108,000 (2.6% of employed population)
— Down 21,000 from 2020 (-0.5 percentage points)
– Workers represented by unions: 142,000 (3.4% of employed population)
— Down 19,000 from 2020 (-0.5 percentage points)
In the years when South Carolina isn’t the least-unionized state, its neighbor to the north often is. North Carolina became a right-to-work state in 1947, making it one of the early adopters of the movement. The right-to-work agenda emerged in the South after World War II, as integrated labor unions began threatening both the economic power structure and the racial power structure in the region.
Pasteur // Wikimedia Commons
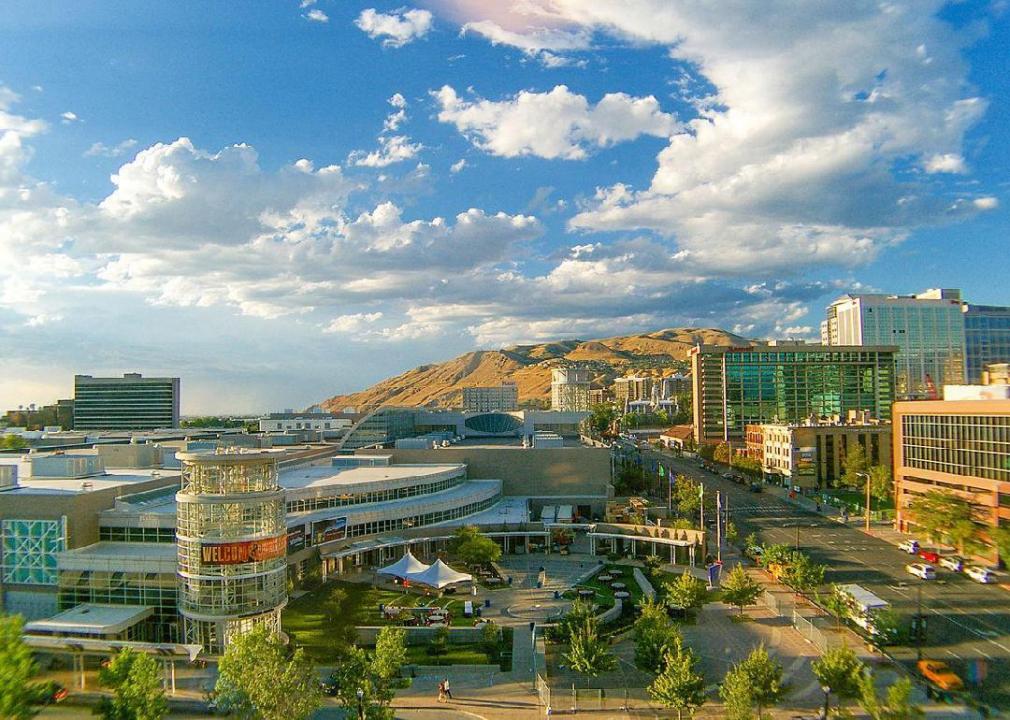
#49. Utah
– Members of unions: 51,000 (3.5% of employed population)
— No change from 2020 (-0.2 percentage points)
– Workers represented by unions: 96,000 (6.5% of employed population)
— Up 21,000 from 2020 (+1.1 percentage points)
In 1955, Utah became the 18th state to join the right-to-work coalition—one of the first states to do so outside of the South. This dynamic, according to the Utah History Encyclopedia, is directly connected to organized labor’s long history of conflict with the Mormon church.
Ryan Conine // Shutterstock
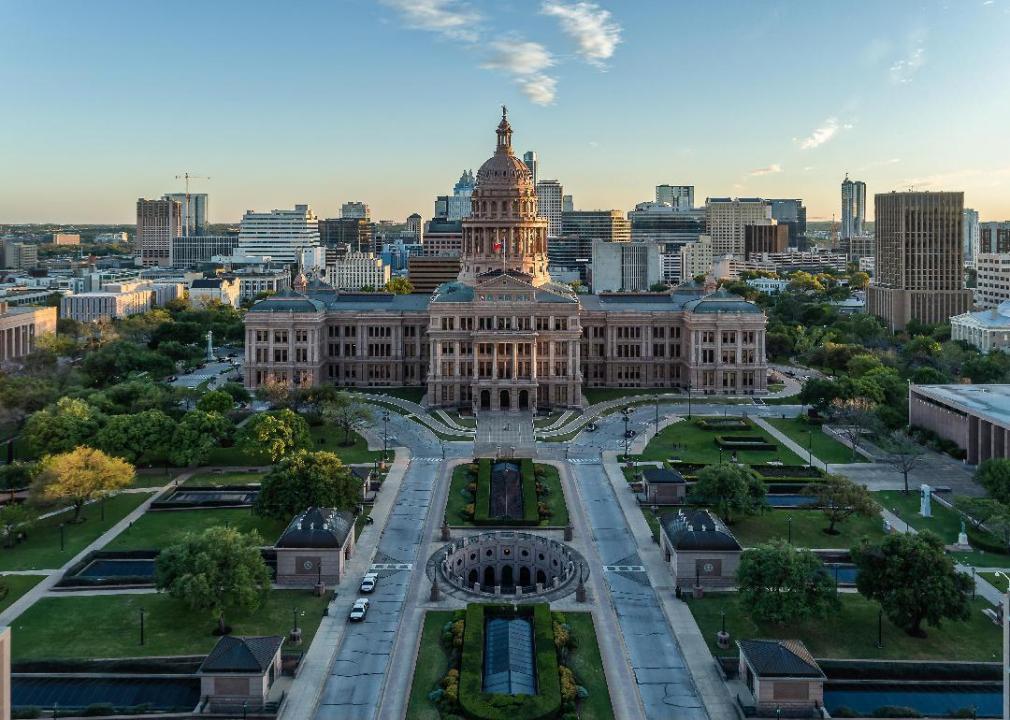
#48. Texas
– Members of unions: 454,000 (3.8% of employed population)
— Down 109,000 from 2020 (-1.1 percentage points)
– Workers represented by unions: 571,000 (4.7% of employed population)
— Down 122,000 from 2020 (-1.3 percentage points)
The term “right to work” was coined by anti-labor oil industry chiefs in Houston in 1936, and no state has been more central to the movement. After World War II, Houston businessman and vocal white supremacist Vance Muse founded the Christian American Association. Through the organization, he leveraged contemporary fears to successfully link unions with both integration and communism in the public imagination, while crafting the first right-to-work laws in Texas.
W. Scott McGill // Shutterstock
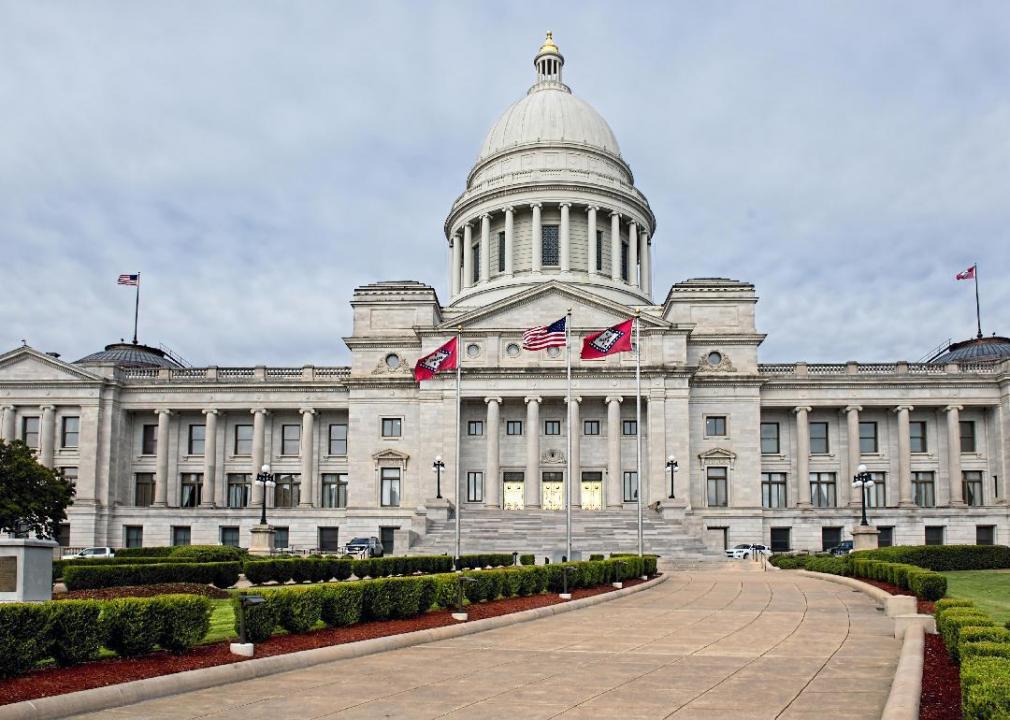
#47. Arkansas
– Members of unions: 46,000 (3.9% of employed population)
— Down 9,000 from 2020 (-0.8 percentage points)
– Workers represented by unions: 51,000 (4.4% of employed population)
— Down 18,000 from 2020 (-1.5 percentage points)
In 2018, a local CBS affiliate reported that union membership was on the rise in Arkansas, despite the state ranking above only 12 other states in terms of current unionization. Now, four years after the supposed boost, Arkansas has dropped even further—behind all but four other states.
You may also like: History of oil in America
Sopotnicki // Shutterstock
#46. South Dakota
– Members of unions: 16,000 (4% of employed population)
— Down 1,000 from 2020 (-0.3 percentage points)
– Workers represented by unions: 20,000 (5% of employed population)
— Down 1,000 from 2020 (-0.5 percentage points)
Back in 2003, the Rapid City Journal ran an article under the headline “Unions Waning in South Dakota.” There were just 19,000 union members left in the state by 2002, down from 21,000 in 1997. Overall membership has continued to decline.
Robbymilo // Wikimedia Commons
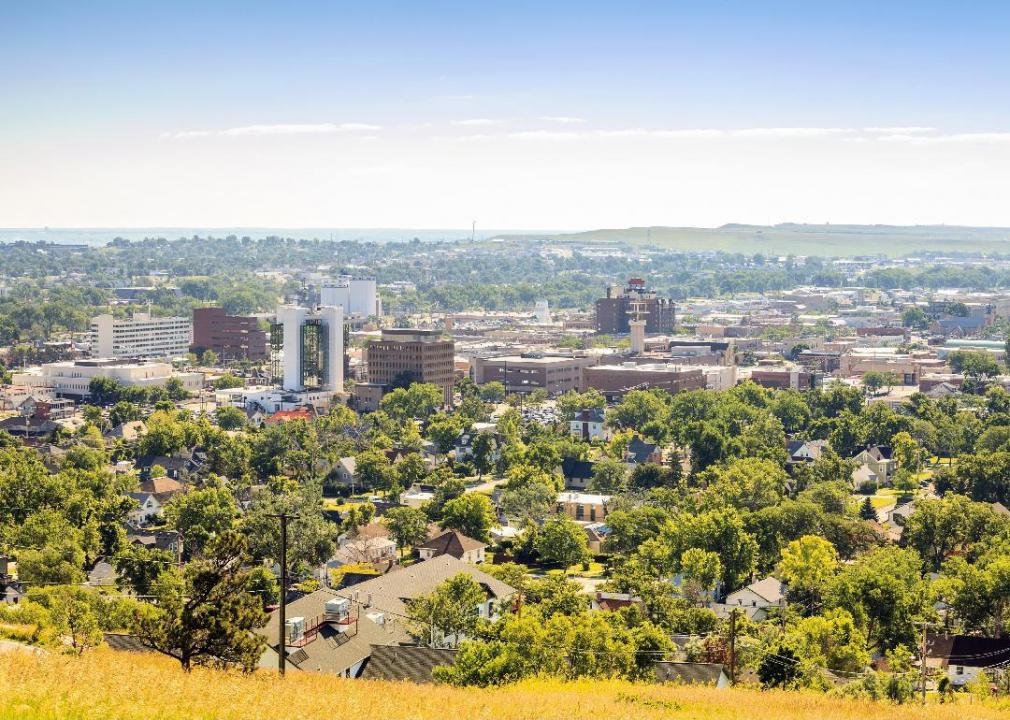
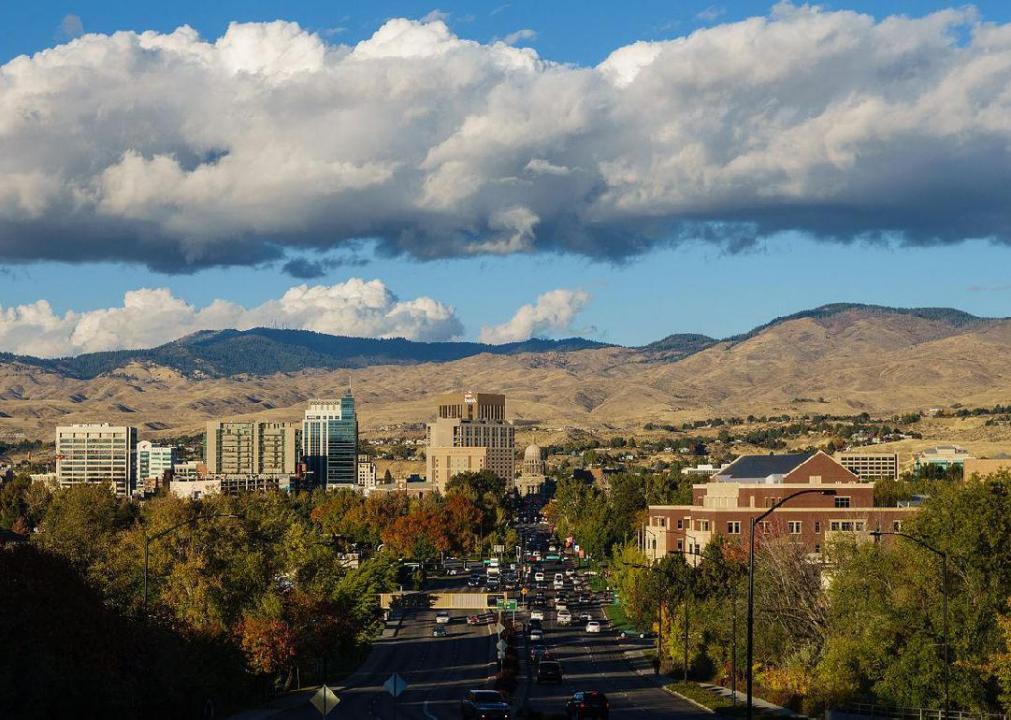
#44. Idaho
– Members of unions: 36,000 (4.7% of employed population)
— Down 5,000 from 2020 (-0.9 percentage points)
– Workers represented by unions: 42,000 (5.5% of employed population)
— Down 5,000 from 2020 (-0.9 percentage points)
Idaho’s union history can be traced back to the first half of the 20th century, to conflicts between laborers and corporate bosses in the booming timber industry. Today, Idaho is one of the 10 least unionized states in the country and part of a confederation of right-to-work states that spreads across the conservative Mountain West.
Sean Pavone // Shutterstock
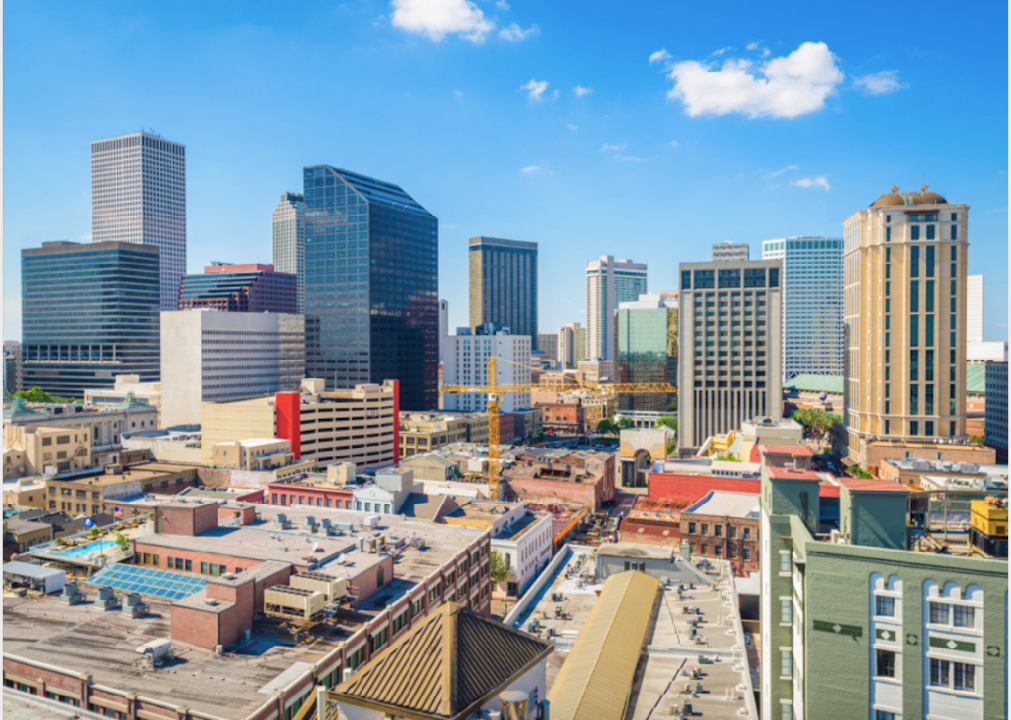
#44. Louisiana
– Members of unions: 81,000 (4.7% of employed population)
— Down 18,000 from 2020 (-1.2 percentage points)
– Workers represented by unions: 98,000 (5.7% of employed population)
— Down 15,000 from 2020 (-1.0 percentage point)
In 1954, a scathing report by a man named William J. Dodd called the adoption of right-to-work laws in Louisiana “without question the most controversial legislative problem considered during the 1954 legislative session.” Although the law’s authors insisted their motives were based in liberating Louisiana workers, Dodd pointed out that the proposed law restricted the use of some of organized labor’s most important tools, like picketing or recruitment. The law was eventually adopted in 1976.
Brett Barnhill // Shutterstock
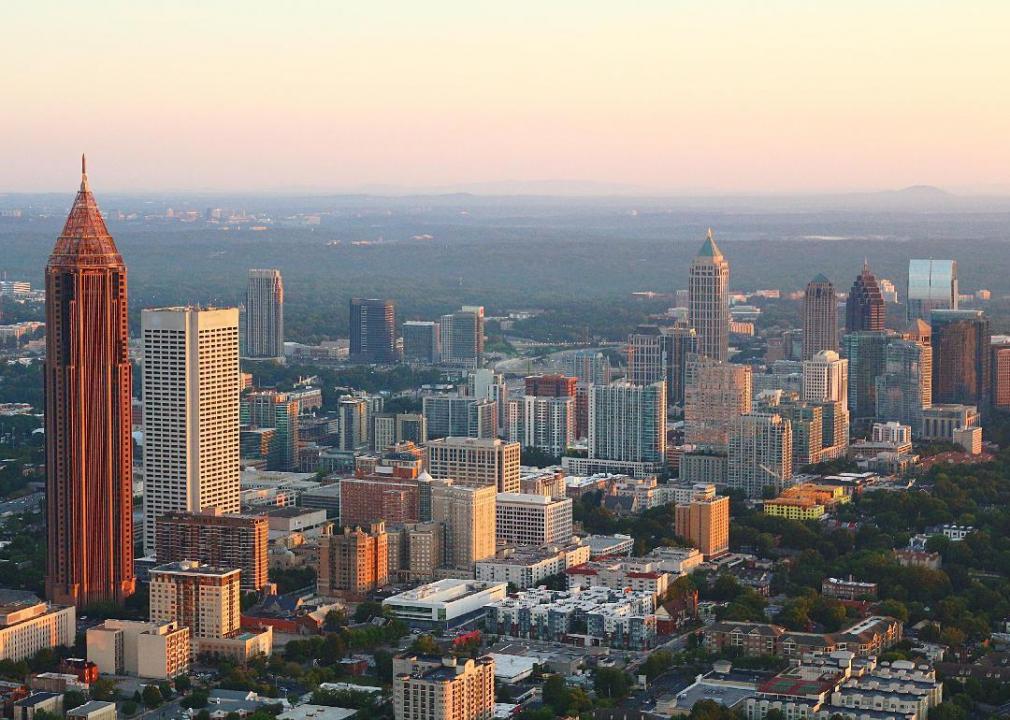
#42. Georgia
– Members of unions: 211,000 (4.8% of employed population)
— Up 17,000 from 2020 (+0.2 percentage points)
– Workers represented by unions: 256,000 (5.8% of employed population)
— Down 15,000 from 2020 (-0.7 percentage points)
In 2016, labor leaders in Georgia cheered as a judge overruled a state law designed to dilute the influence of unions there even further. Despite that narrow victory, Georgia remains committed to protecting its well-earned image as a pro-business state, a status often won at the expense of its workers.
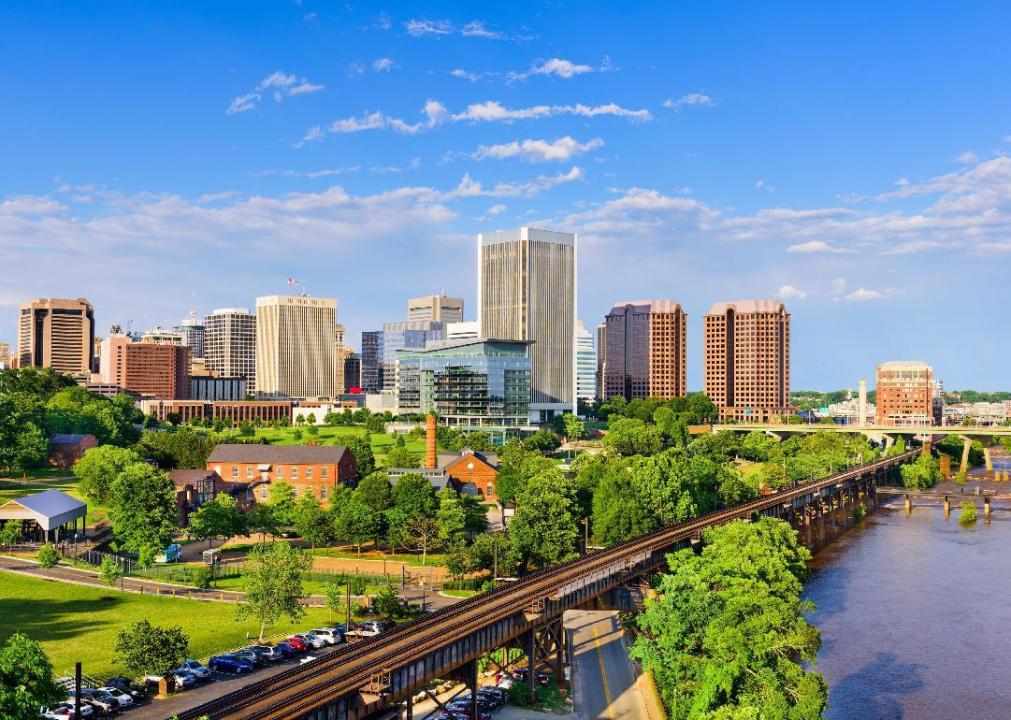
Sean Pavone // Shutterstock
#42. Virginia
– Members of unions: 176,000 (4.8% of employed population)
— Up 12,000 from 2020 (+0.4 percentage points)
– Workers represented by unions: 240,000 (6.5% of employed population)
— Up 39,000 from 2020 (+1.1 percentage points)
Although the 2020 election saw Democrats flip Virginia, the state is still part of the South, where the modern anti-labor movement was born. Despite the change in leadership, Virginia’s right-to-work laws have thus far proven too deeply entrenched for progressives in the state to uproot.
You may also like: 25 IPOs that bombed on their first day

Jillian Cain Photography // Shutterstock
#40. Florida
– Members of unions: 448,000 (5.2% of employed population)
— Down 76,000 from 2020 (-1.2 percentage points)
– Workers represented by unions: 529,000 (6.1% of employed population)
— Down 115,000 from 2020 (-1.8 percentage points)
When Florida was called for President Trump in the 2020 election, it became clear that Democrats would not get the election night knockout punch they had hoped for. Their allies in labor, however, won a major victory in the Sunshine State that day. More than 60% of voters passed a ballot measure that will raise the state minimum wage from $8.56 to $15 an hour by 2026, giving 2.5 million low-wage Florida workers a raise.
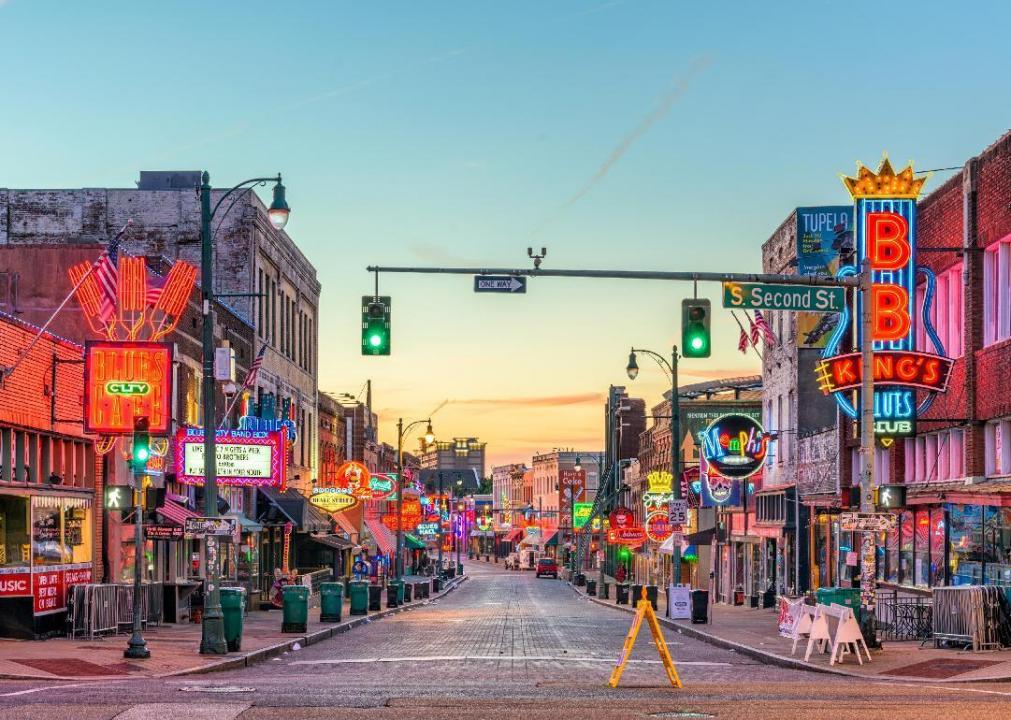
Sean Pavone // Shutterstock
#40. Tennessee
– Members of unions: 145,000 (5.2% of employed population)
— Up 28,000 from 2020 (+0.8 percentage points)
– Workers represented by unions: 166,000 (5.9% of employed population)
— Up 29,000 from 2020 (+0.8 percentage points)
Tennessee is part of America’s right-to-work stronghold in the South, where union membership has dwindled to about 5% of the workforce. In 2020, state leadership proposed an amendment enshrining right-to-work language in the Tennessee constitution.
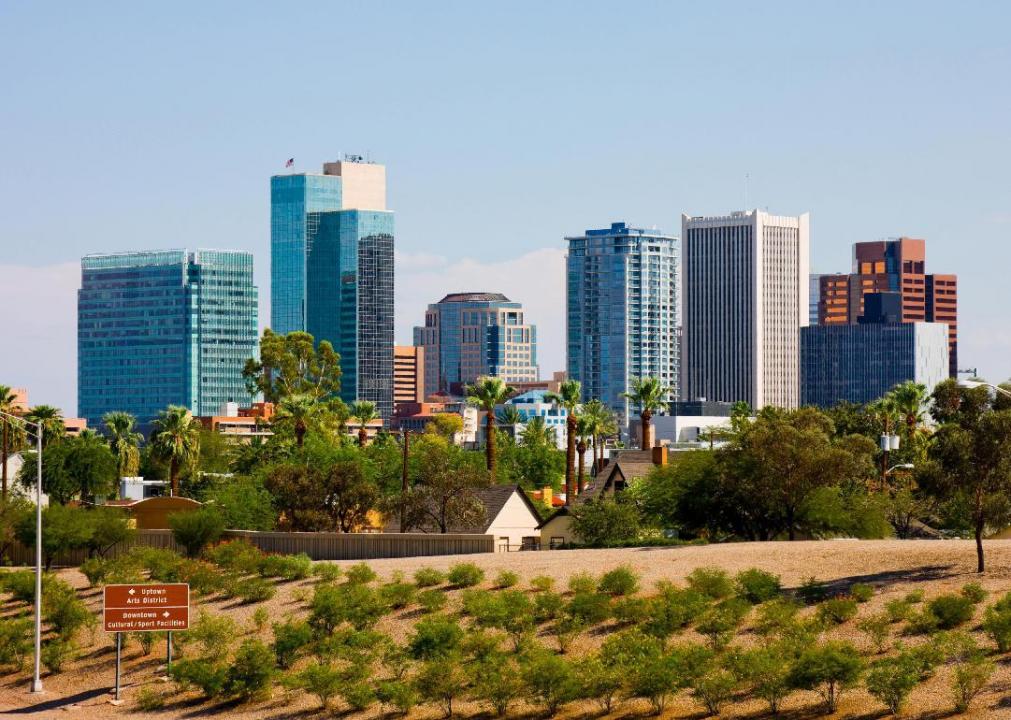
Andrew Zarivny // Shutterstock
#38. Arizona
– Members of unions: 167,000 (5.4% of employed population)
— Up 12,000 from 2020 (+0.1 percentage points)
– Workers represented by unions: 208,000 (6.7% of employed population)
— Up 1,000 from 2020 (-0.4 percentage points)
Arizona’s union history revolves around the mining industry, in a relationship that was often volatile and frequently violent, with race, immigration, and the inherent unpredictability of the metals industry fanning the flames. Unions have faced an uphill battle in the state since the first right-to-work laws were enacted in 1947.
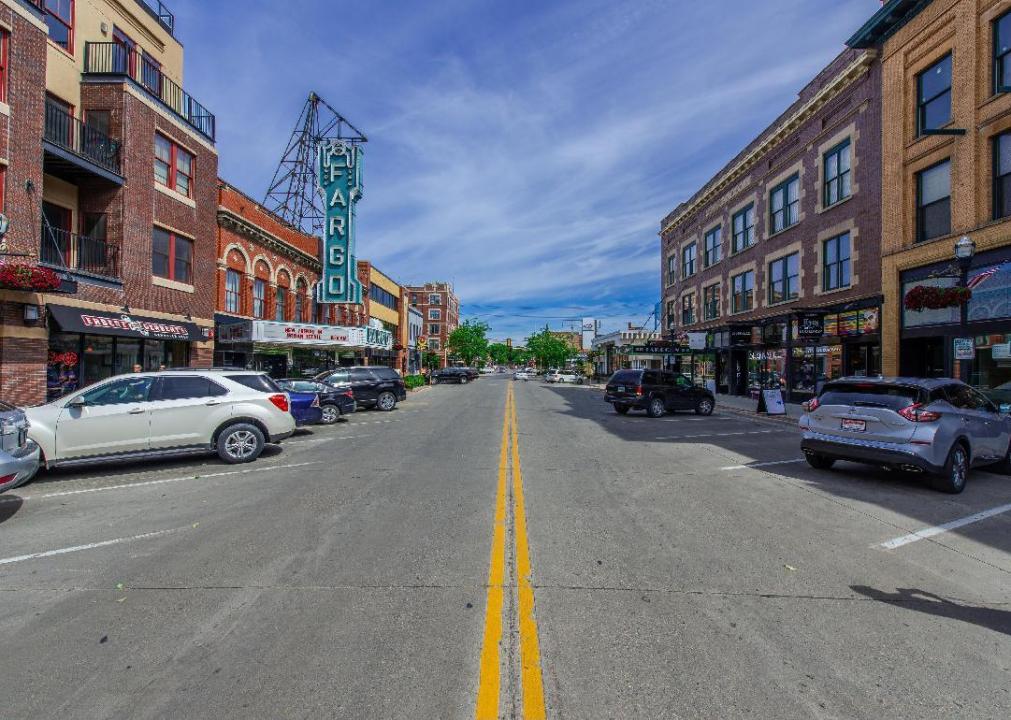
Guy RD // Shutterstock
#38. North Dakota
– Members of unions: 19,000 (5.4% of employed population)
— Down 2,000 from 2020 (-0.8 percentage points)
– Workers represented by unions: 24,000 (6.9% of employed population)
— Down 1,000 from 2020 (-0.5 percentage points)
In 2020, The New Yorker investigated an interesting labor situation in North Dakota. Tensions were rising between Democratic Party opponents of the controversial Dakota Access pipeline and the labor unions that represented the workers. The infighting waned when the two groups seemed to find common ground, as large numbers of oil workers shifted to clean-energy jobs operating wind turbines—while oil industry employment stagnated.
Ken L. // Wikimedia Commons
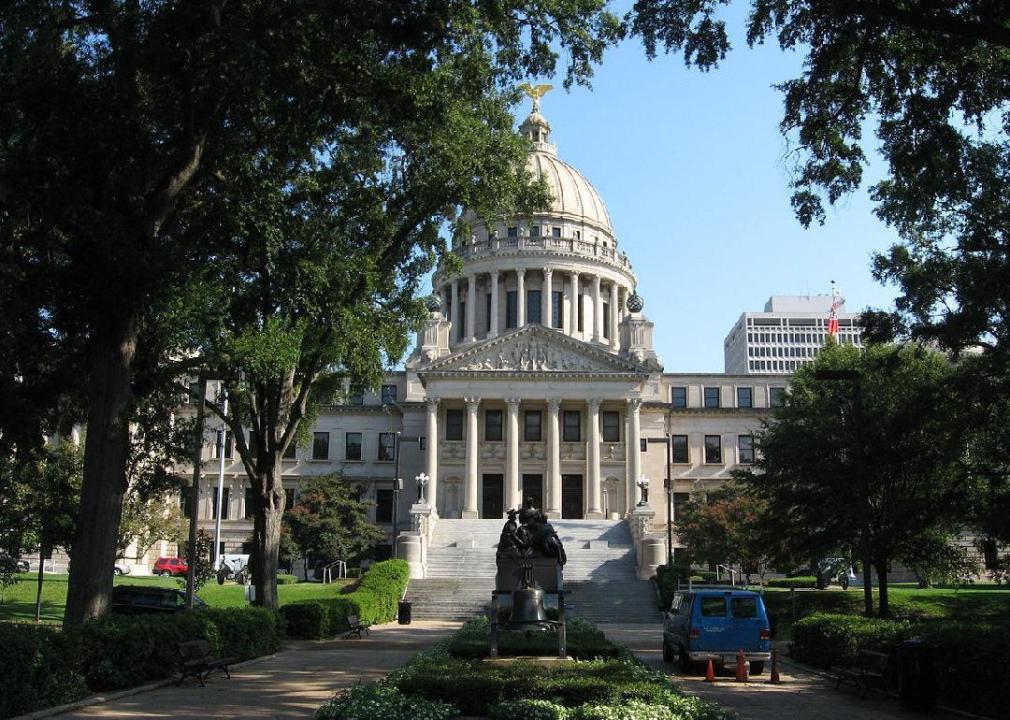
#37. Mississippi
– Members of unions: 59,000 (5.5% of employed population)
— Down 15,000 from 2020 (-1.6 percentage points)
– Workers represented by unions: 74,000 (6.9% of employed population)
— Down 12,000 from 2020 (-1.4 percentage points)
In the tumultuous 1950s and ’60s, union membership plummeted in Mississippi and much of the South as labor leaders allied with civil rights organizations. Union membership remains down in Mississippi as the state is still dominated by pro-business conservatives hostile toward the labor movement and suspicious of unions.
You may also like: Cost of gold the year you were born
Oklahoma CIty Convention and Visitor’s Bureau // Wikimedia Commons
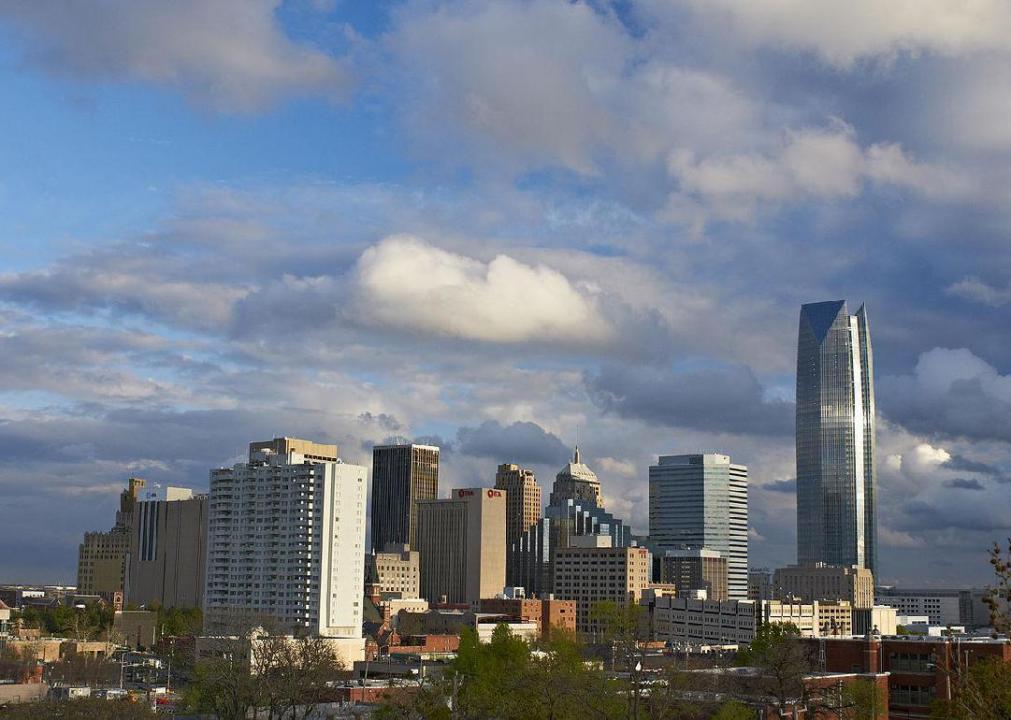
#36. Oklahoma
– Members of unions: 87,000 (5.6% of employed population)
— Down 3,000 from 2020 (-0.4 percentage points)
– Workers represented by unions: 105,000 (6.8% of employed population)
— Down 9,000 from 2020 (-0.8 percentage points)
Union culture in Oklahoma began when the state was still a territory, through labor uprisings in the mining industry. The arrival of the railroad brought a new breed of union to Oklahoma, followed by the rise of agricultural unions in the state, and finally the appearance of trade unions.
J. Norman Reid // Shutterstock
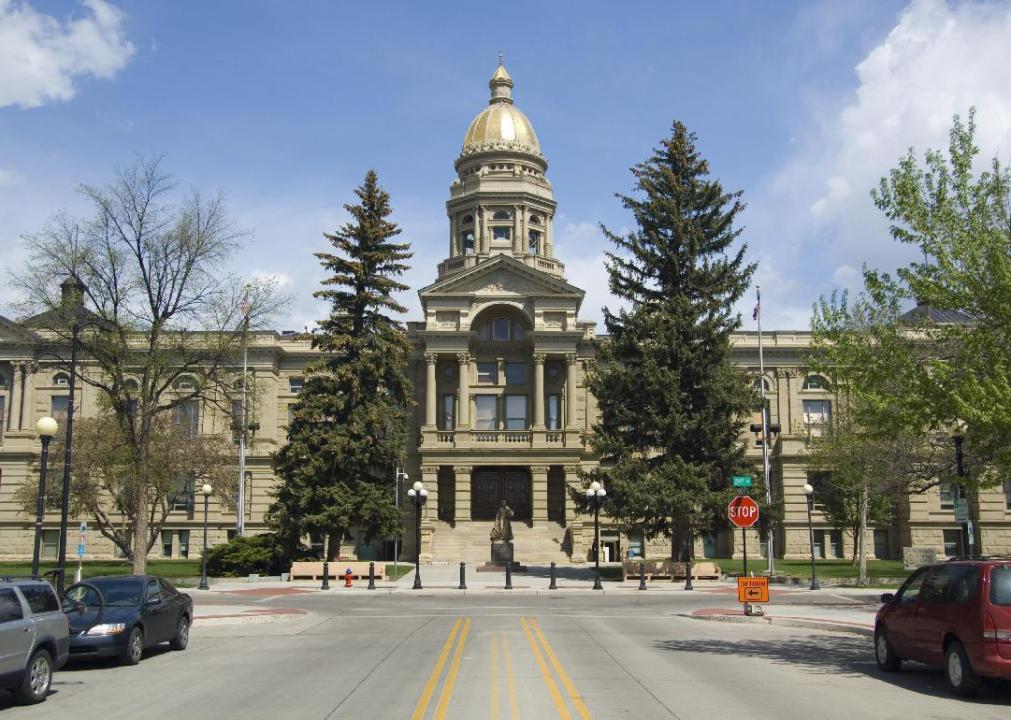
#35. Wyoming
– Members of unions: 13,000 (5.7% of employed population)
— Down 5,000 from 2020 (-1.9 percentage points)
– Workers represented by unions: 16,000 (6.9% of employed population)
— Down 6,000 from 2020 (-2.4 percentage points)
Wyoming serves as the bridge between two solid blocks of right-to-work states—one in the Midwest and the other in the Mountain West. To Wyoming’s east are solid-red North Dakota down through Texas and to the west are Idaho, Utah, Nevada, and Arizona.
BJ Ray // Shutterstock
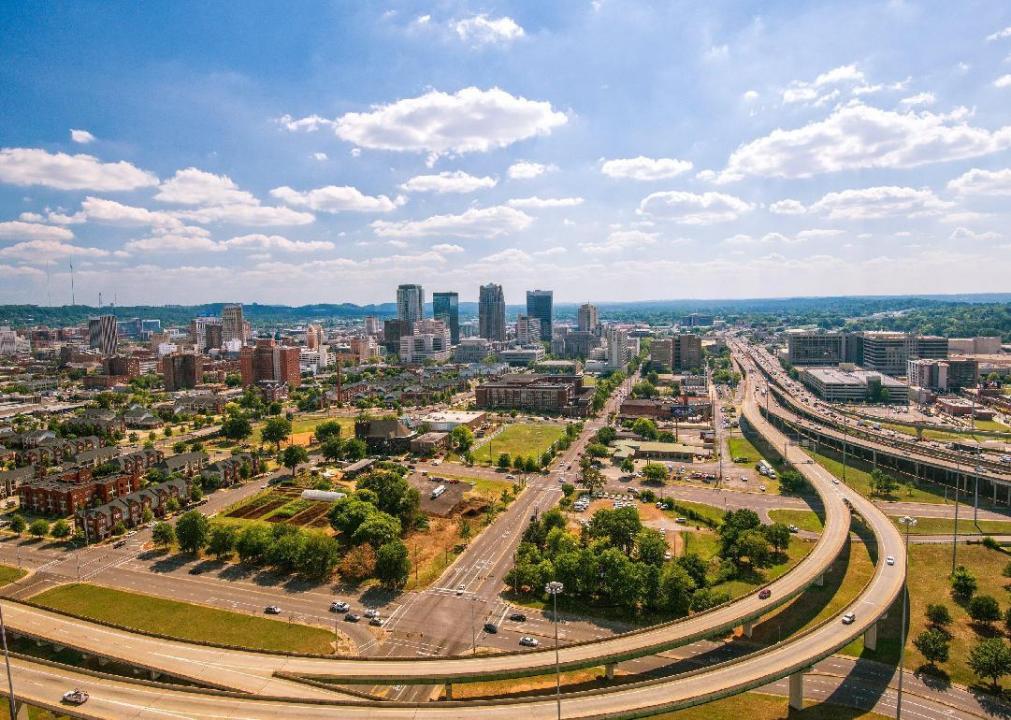
#34. Alabama
– Members of unions: 115,000 (5.9% of employed population)
— Down 36,000 from 2020 (-2.1 percentage points)
– Workers represented by unions: 133,000 (6.9% of employed population)
— Down 31,000 from 2020 (-1.8 percentage points)
Although the number of union members found among Alabama’s employed population is still below the national average, it’s significantly higher than its neighbors in the Deep South, the heart of America’s right-to-work culture.

Schlendiran // Wikimedia Commons
#32. Colorado
– Members of unions: 165,000 (6.5% of employed population)
— Down 17,000 from 2020 (-0.9 percentage points)
– Workers represented by unions: 192,000 (7.5% of employed population)
— Down 10,000 from 2020 (-0.7 percentage points)
In 2018, something happened in Colorado that’s a rarity in the modern era—union membership increased from 9.6% to 11%. The success was short-lived, however, and the state is now all the way down to 6.5%, its lowest union membership level since 2015.
Alan Light // Flickr
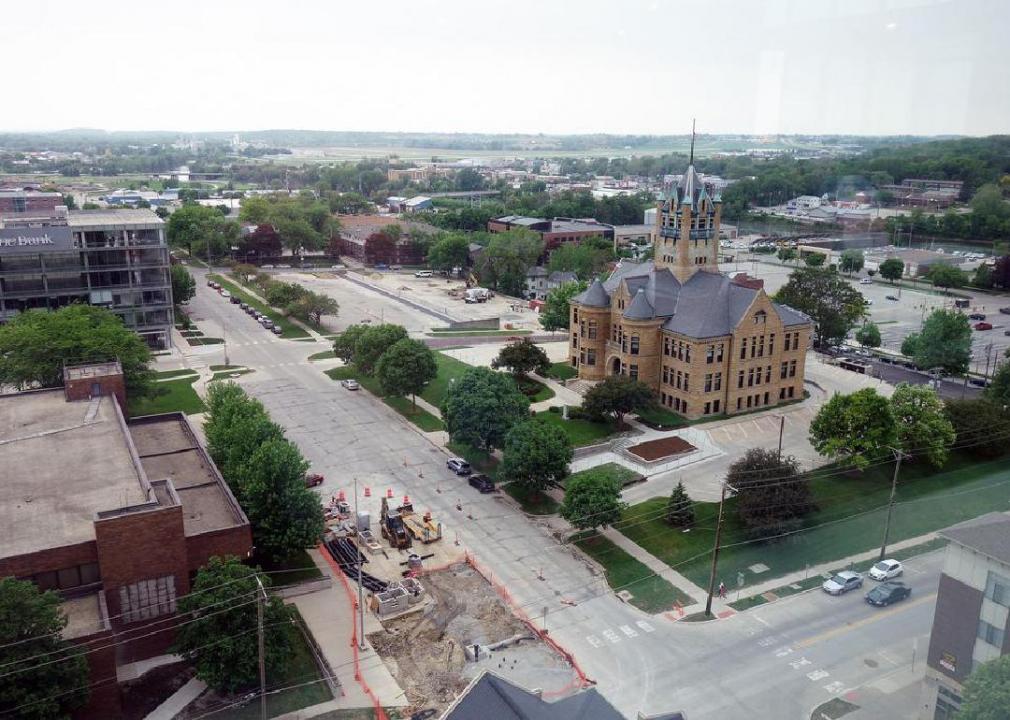
#32. Iowa
– Members of unions: 93,000 (6.5% of employed population)
— No change from 2020 (-0.1 percentage points)
– Workers represented by unions: 118,000 (8.3% of employed population)
— Down 10,000 from 2020 (-0.8 percentage points)
As the 2020 presidential election grabbed all the headlines, thousands of public employees in Iowa turned out to vote in union recertification elections that determine whether or not they’ll retain their collective bargaining power. In 2017, Iowa’s conservative leaders succeeded in creating the recertification requirements to weaken unions further in the right-to-work state, but Democratic lawmakers have fought back.
You may also like: History of manufacturing in America
Public Domain
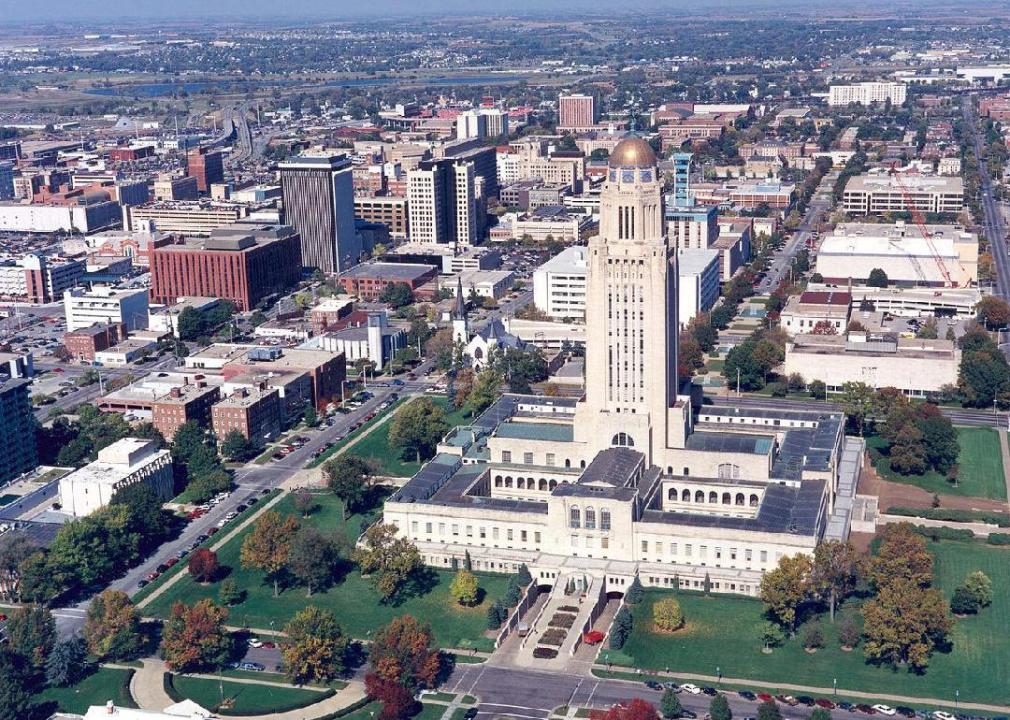
#31. Nebraska
– Members of unions: 61,000 (6.8% of employed population)
— Down 24,000 from 2020 (-2.8 percentage points)
– Workers represented by unions: 72,000 (8% of employed population)
— Down 22,000 from 2020 (-2.5 percentage points)
At the turn of the 20th century, bakers in Omaha went on strike to protest $10 weekly wages for 10-17 hour workdays in sweltering hot, subterranean oven facilities that were commonly worked by children. However, anti-union legislation enacted in the 1940s established Nebraska as one of the oldest right-to-work states in America and part of the anti-union stronghold in middle America that runs from the Dakotas down through Texas.

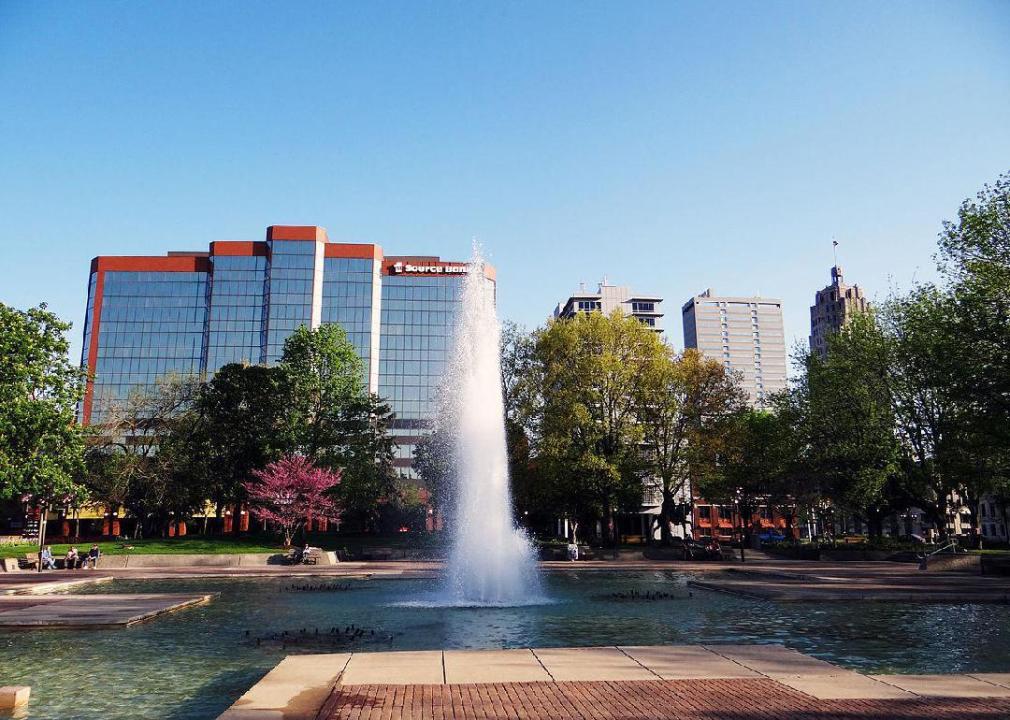
Thomas Kelley // Shutterstock
#30. Kentucky
– Members of unions: 126,000 (7.2% of employed population)
— Down 1,000 from 2020 (-0.3 percentage points)
– Workers represented by unions: 170,000 (9.8% of employed population)
— Up 10,000 from 2020 (+0.4 percentage points)
Few states have a labor history as dramatic, bloody, and consequential as the coal wars that consumed Kentucky throughout the late 1800s and early 20th century—particularly the Harlan County War of the 1930s. In recent years, Kentucky has never been able to compete with Ohio and West Virginia in terms of the percentage of its miners who were union members. Membership plummeted from an already low 35% of miners in 1997 to 17% in 2017.
Asaavedra32 // Wikimedia Commons
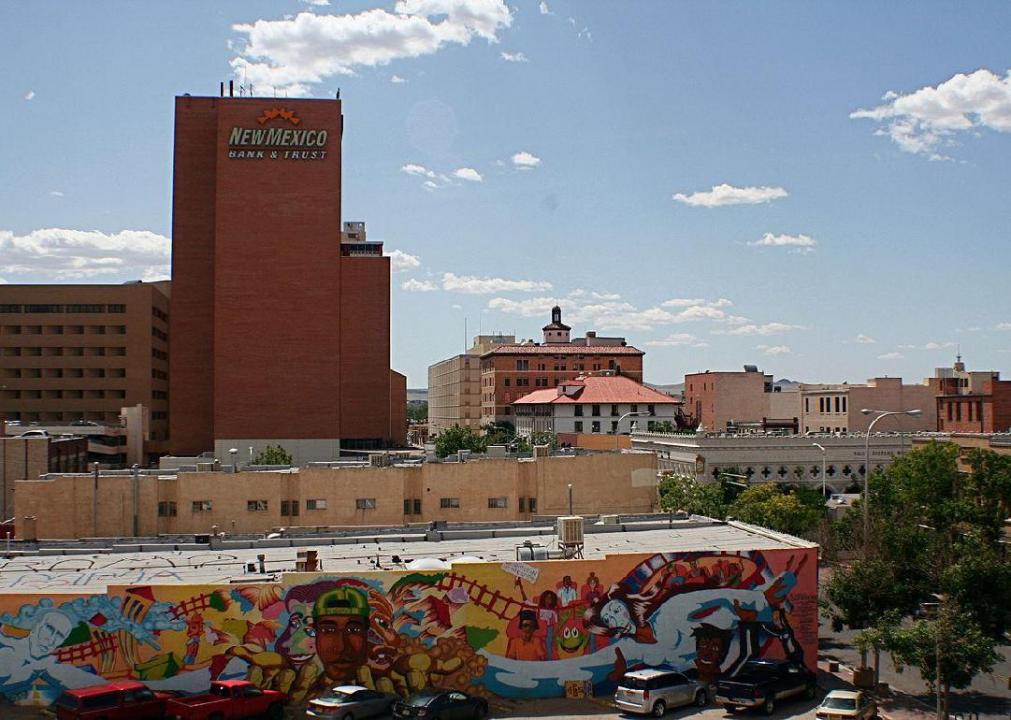
#29. New Mexico
– Members of unions: 58,000 (7.5% of employed population)
— Up 5,000 from 2020 (+0.4 percentage points)
– Workers represented by unions: 70,000 (9.1% of employed population)
— Up 6,000 from 2020 (+0.5 percentage points)
New Mexico—which is not a right-to-work state—includes an employed population with more than 7% union membership. That number was up over 8% as recently as 2017, but even that represents a decline from pre-recession membership.
Public Domain
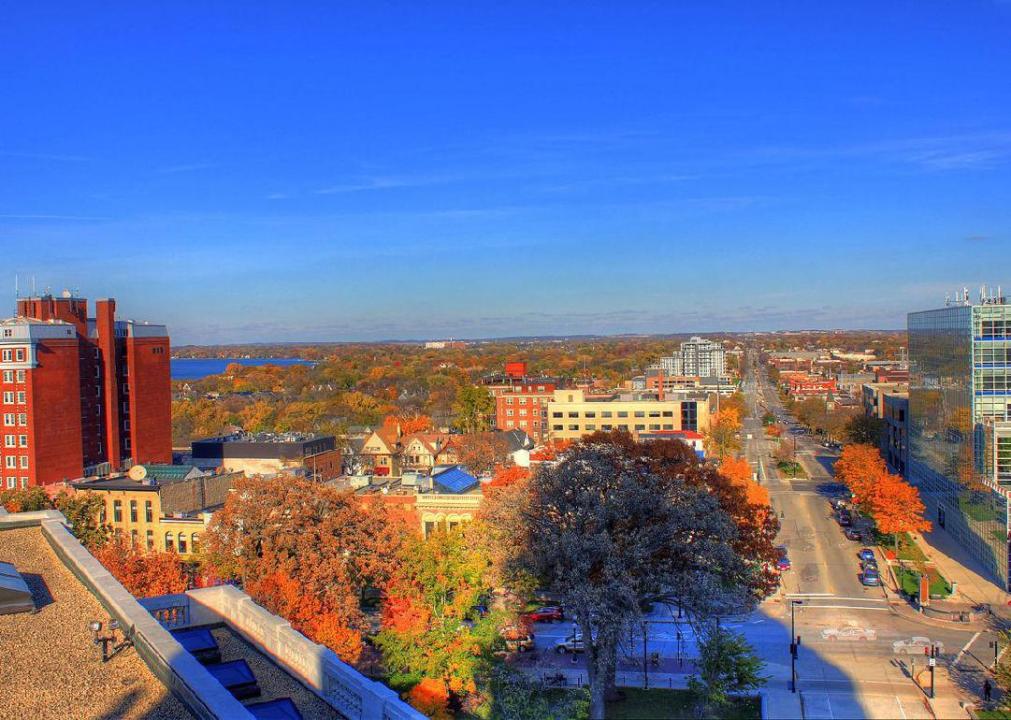
#28. Wisconsin
– Members of unions: 215,000 (7.9% of employed population)
— Down 12,000 from 2020 (-0.8 percentage points)
– Workers represented by unions: 251,000 (9.3% of employed population)
— Down 13,000 from 2020 (-0.9 percentage points)
Despite its long history as a labor stronghold for American agriculture and industry, Wisconsin is now a right-to-work state with membership numbers that lag well below the national average. The state’s membership percentages have also declined much more rapidly than they have in the country as a whole. In 1983, nationwide union membership had dropped to 18%, but nearly one in four Wisconsinites were still represented by organized labor.
Songquan Deng // Shutterstock
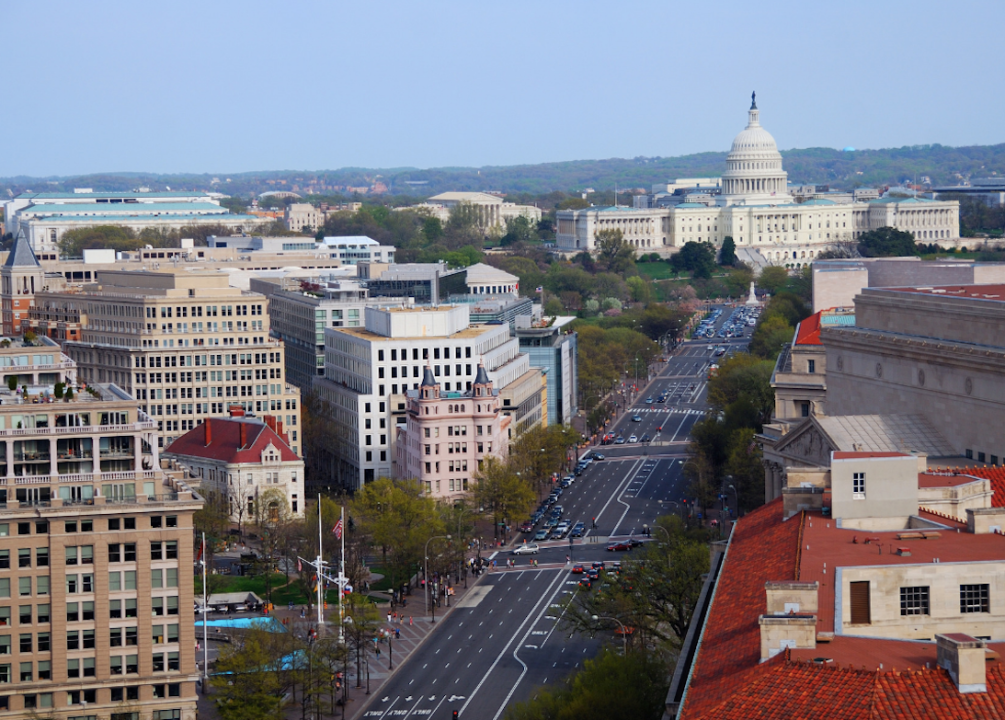
#27. District of Columbia
– Members of unions: 31,000 (8.9% of employed population)
— Up 1,000 from 2020 (+0.3 percentage points)
– Workers represented by unions: 35,000 (9.9% of employed population)
— Up 2,000 from 2020 (+0.4 percentage points)
The District of Columbia is situated right on the border of the pro-union Northeast and the South, where right-to-work laws first emerged and remain the strongest. Today, District government employees alone are represented by 114 collective bargaining units, 48 locals, and 15 international unions.
You may also like: Major boycotts that changed history
Momoneymoproblemz // Wikimedia Commons
#25. Indiana
– Members of unions: 256,000 (9% of employed population)
— Up 21,000 from 2020 (+0.7 percentage points)
– Workers represented by unions: 290,000 (10.2% of employed population)
— Up 20,000 from 2020 (+0.7 percentage points)
Union membership in Indiana reached 11.3% in 2011. The next year, the state enacted right-to-work legislation, and the decades-long decline in union membership quickly accelerated.
Brian Hillegas // Wikimedia Commons
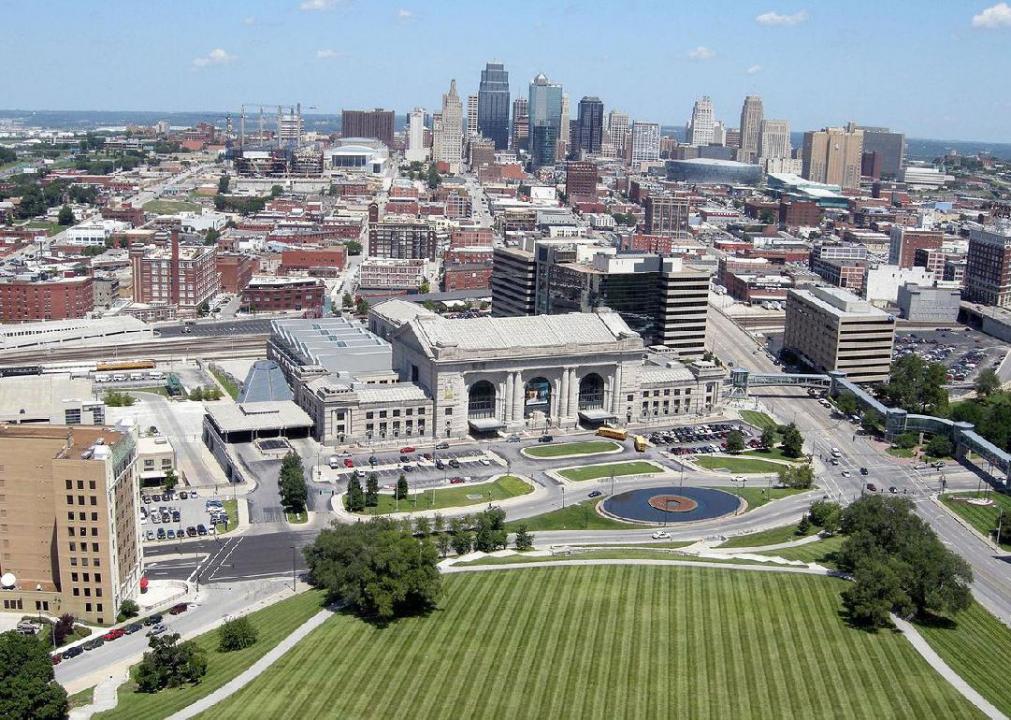
#25. Missouri
– Members of unions: 235,000 (9% of employed population)
— Down 3,000 from 2020 (-0.4 percentage points)
– Workers represented by unions: 266,000 (10.2% of employed population)
— Up 12,000 from 2020 (+0.1 percentage points)
Missouri and neighboring Illinois are an island in a sea of right-to-work states, and Missouri voters chose to keep it that way when the issue came to a vote in 2018. A proposed right-to-work law was rejected by 67% of Missourians—an overwhelming majority.

Sean Pavone // Shutterstock
#24. Kansas
– Members of unions: 120,000 (9.2% of employed population)
— Up 6,000 from 2020 (+0.3 percentage points)
– Workers represented by unions: 148,000 (11.4% of employed population)
— Up 4,000 from 2020 (+0.2 percentage points)
In 2018, while Missouri was overwhelmingly rejecting a right-to-work measure, neighboring Kansas marked its 60-year anniversary as a right-to-work state. According to the Lawrence Journal-World, early labor opponents in Kansas were successful in exploiting fears of communism and integration to fracture a long-standing alliance between farmers and industry workers.
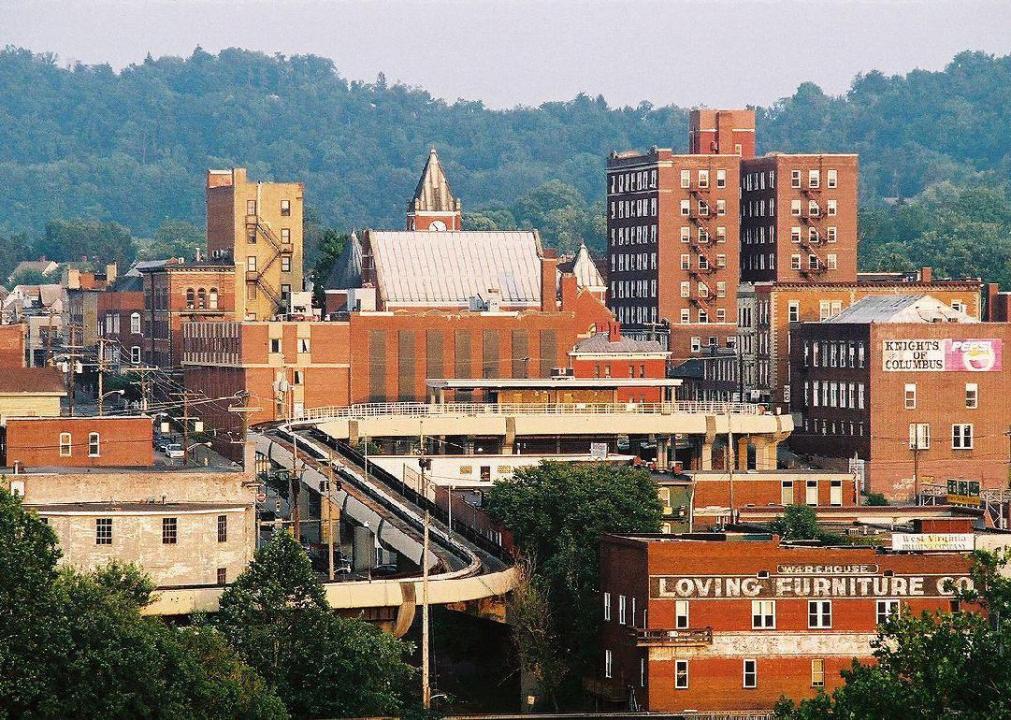
Darren Ringer // Wikimedia Commons
#23. West Virginia
– Members of unions: 66,000 (9.6% of employed population)
— Down 5,000 from 2020 (-1.1 percentage points)
– Workers represented by unions: 73,000 (10.5% of employed population)
— Down 2,000 from 2020 (-0.8 percentage points)
West Virginia’s labor history is rich in drama. Like Kentucky, West Virginia was a primary battleground for the coal wars—where mining bosses and their collaborators in law enforcement and government terrorized, arrested, evicted, harassed, and murdered labor leaders and union members. In 1921, as many as 100 people died in the Blair Mountain Massacre, the largest labor uprising in American history, when strikebreakers and their allies in the military and police attacked thousands of West Virginia miners and their families.
Public Domain
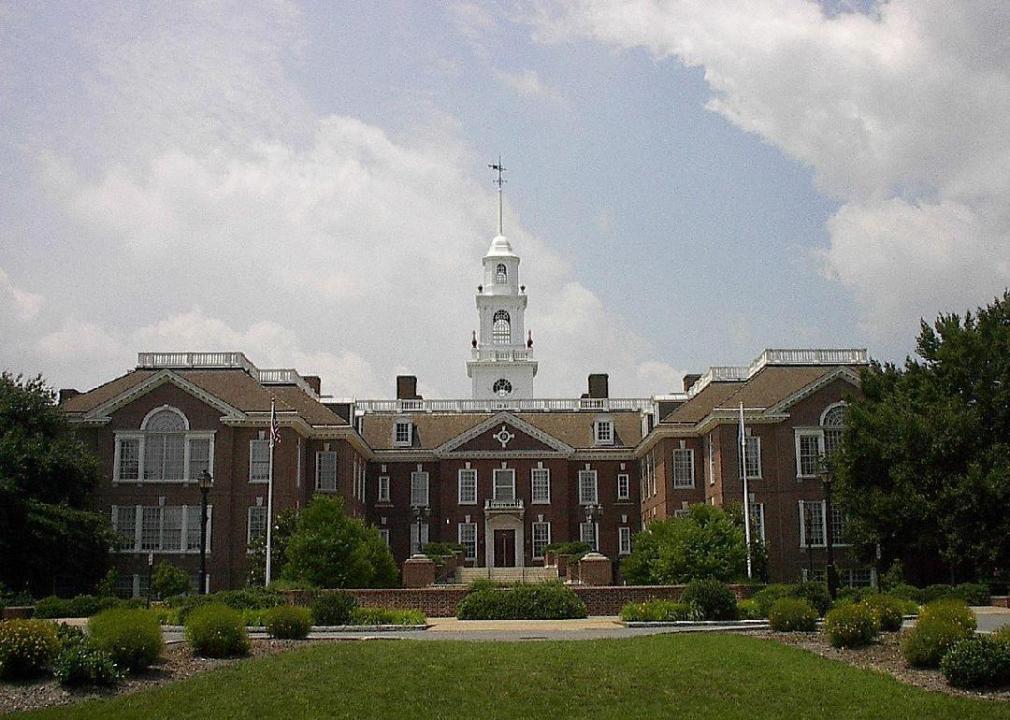
#22. Delaware
– Members of unions: 42,000 (9.7% of employed population)
— Up 1,000 from 2020 (no percentage point change)
– Workers represented by unions: 44,000 (10.2% of employed population)
— No change from 2020 (-0.1 percentage points)
Despite being halfway through the list, Delaware is one of only a few states so far that doesn’t enforce right-to-work laws, a fact that reinforces just how detrimental those kinds of laws are to organized labor. At the start of 2020, Delaware made headlines when its employees in the state legislature announced plans to unionize.
You may also like: 50 jobs that no longer exist
AlexiusHoratius // Wikimedia Commons
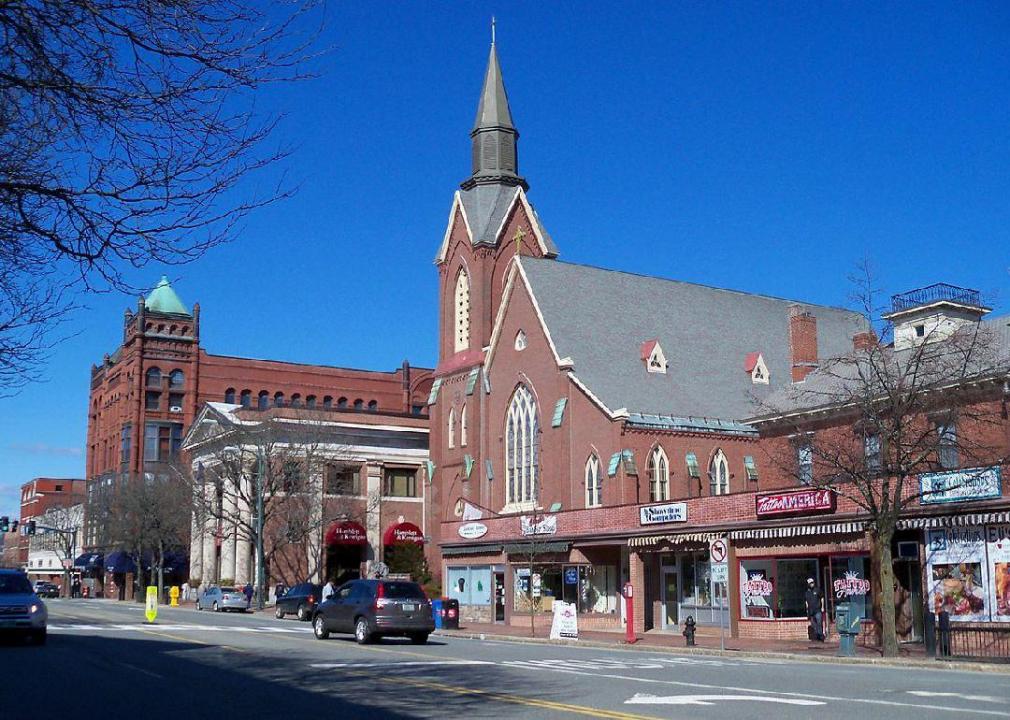
#21. New Hampshire
– Members of unions: 65,000 (10.1% of employed population)
— Up 3,000 from 2020 (+0.3 percentage points)
– Workers represented by unions: 73,000 (11.3% of employed population)
— Up 3,000 from 2020 (+0.2 percentage points)
Despite trending Republican from the late 1940s through the late 1980s, New Hampshire is now a reliably Democratic state. Labor unions there are small but influential. In 2017, organized labor in New Hampshire led a successful effort to defeat proposed right-to-work legislation in the state.
Mbell1975 // Wikimedia Commons
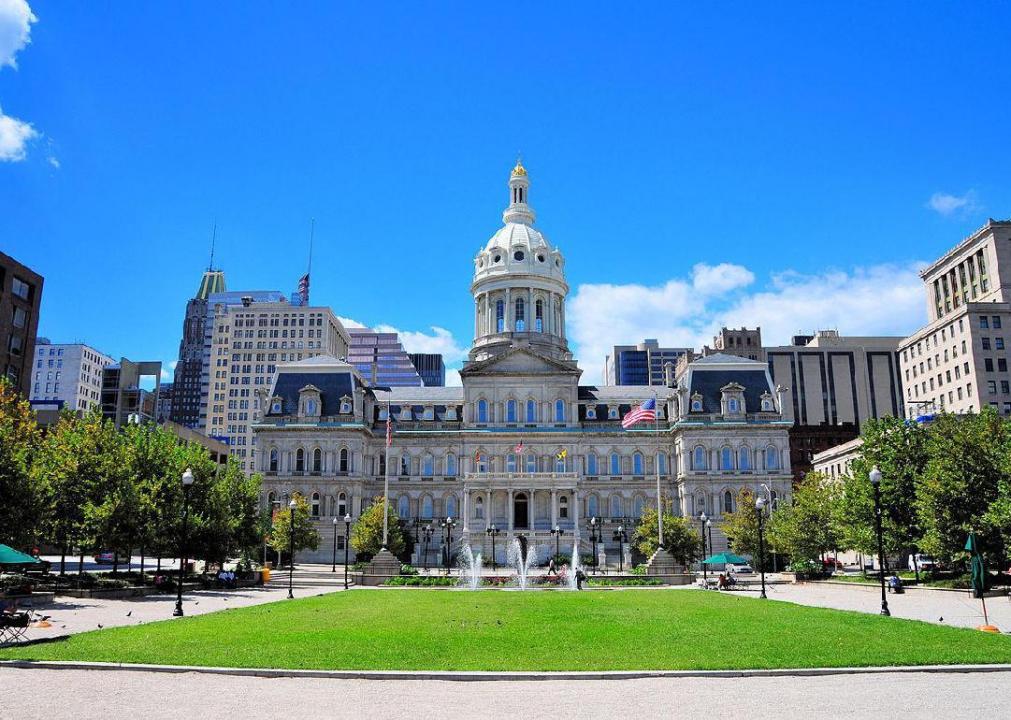
#20. Maryland
– Members of unions: 295,000 (11% of employed population)
— Down 56,000 from 2020 (-2.1 percentage points)
– Workers represented by unions: 332,000 (12.3% of employed population)
— Down 48,000 from 2020 (-1.8 percentage points)
In Maryland, the top two Food and Commercial Workers local unions represent the largest number of union members in the state by far. Together, locals 400 and 27 boast more than 39,000 members.
Paul Brady Photography // Shutterstock
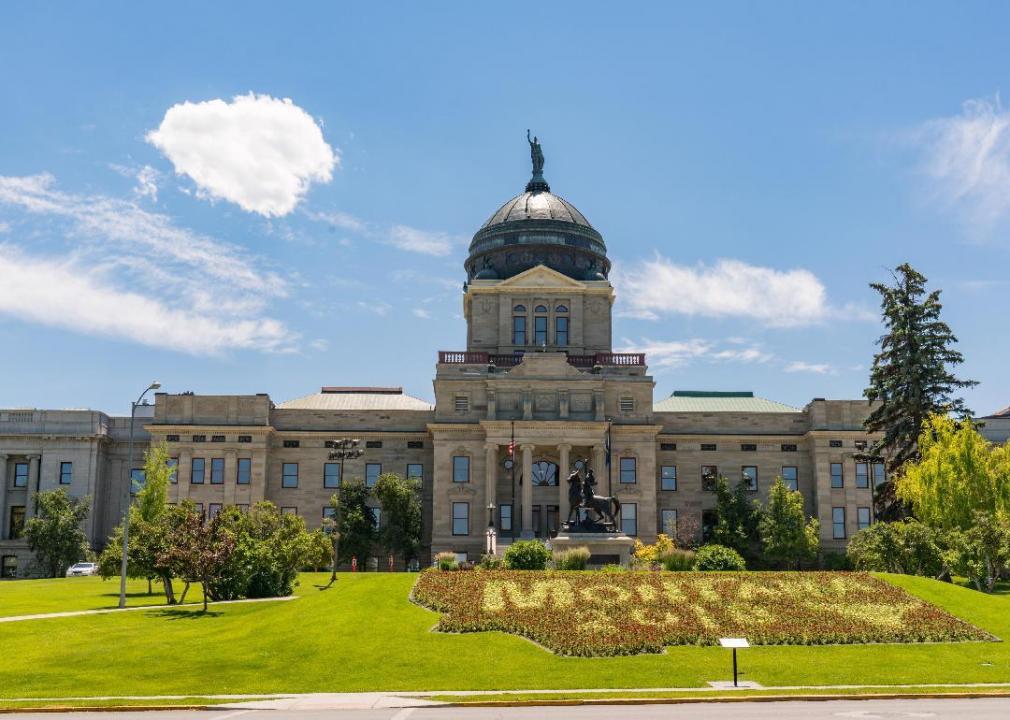
#19. Montana
– Members of unions: 49,000 (11.2% of employed population)
— Down 1,000 from 2020 (-0.8 percentage points)
– Workers represented by unions: 56,000 (12.9% of employed population)
— Up 2,000 from 2020 (-0.1 percentage points)
Off the coast, the entire inland Western United States from Missouri to the Pacific Ocean is made up of right-to-work states except three: blue Colorado and New Mexico, which fit the pattern, and ruby red Montana. A right-to-work bill, supported by the state’s Republican governor, was defeated on the floor of the Montana House of Representatives in March 2021.
Public Domain
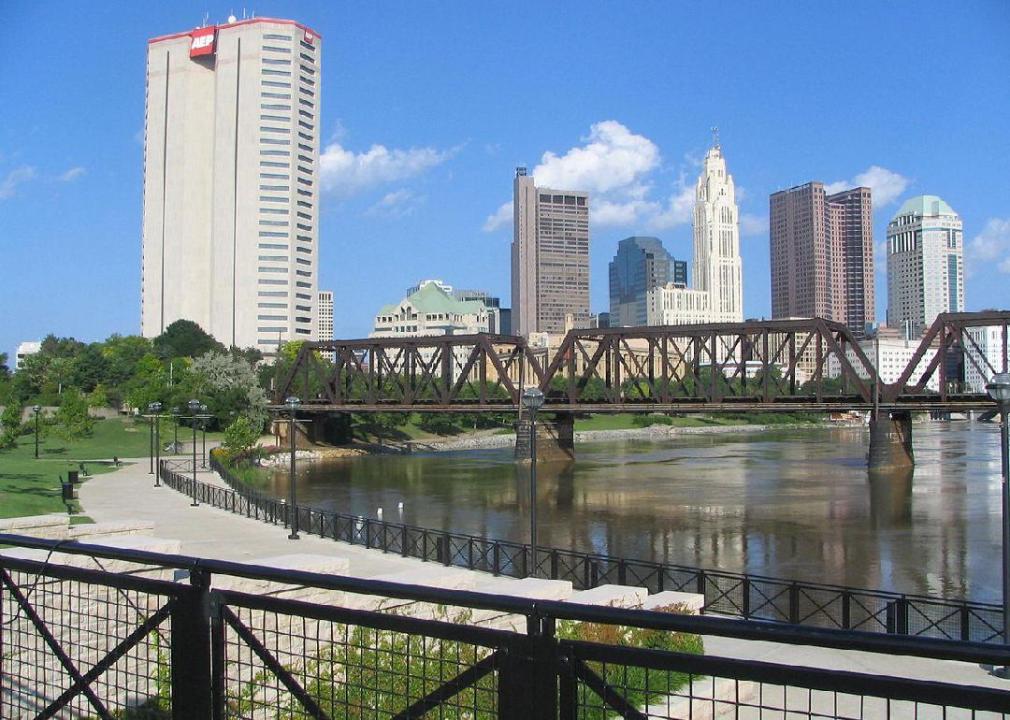
#18. Ohio
– Members of unions: 596,000 (12% of employed population)
— Down 41,000 from 2020 (-1.2 percentage points)
– Workers represented by unions: 647,000 (13% of employed population)
— Down 39,000 from 2020 (-1.2 percentage points)
A strange and headline-generating reversal of alliances played out in a battle between a Republican incumbent and Democratic challenger in a 2018 Ohio House election: virtually all significant unions in both the public and private sectors endorsed the GOP incumbent. Nationally, 90% of union spending goes to Democrats, but in Ohio in 2019 it was almost evenly split.

littlenySTOCK // Shutterstock
#17. Nevada
– Members of unions: 153,000 (12.2% of employed population)
— Down 8,000 from 2020 (-1.2 percentage points)
– Workers represented by unions: 176,000 (14.1% of employed population)
— Down 10,000 from 2020 (-1.3 percentage points)
The sheer size of the Las Vegas hospitality industry makes Nevada hard to compare to other states, but it has proven to be a model for union strength in modern times. However, its union membership has declined in recent years.
You may also like: Cost of gas the year you started driving
Public Domain
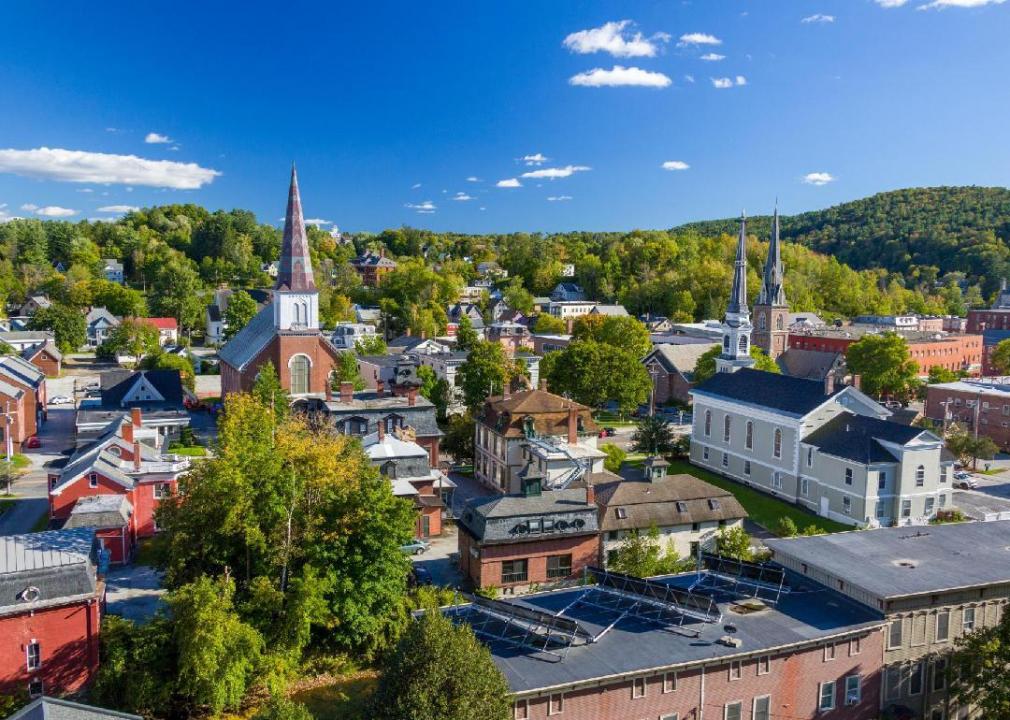
#16. Vermont
– Members of unions: 32,000 (12.3% of employed population)
— Up 1,000 from 2020 (+0.5 percentage points)
– Workers represented by unions: 37,000 (14.2% of employed population)
— Up 1,000 from 2020 (+0.4 percentage points)
Like all of its New England neighbors and the Northeast in general, Vermont is not a right-to-work state. In October 2020, the state’s Republican governor signed a bill that expands access to new employees for public-sector unions and includes other protections for organized labor.
Christopher Boswell // Shutterstock
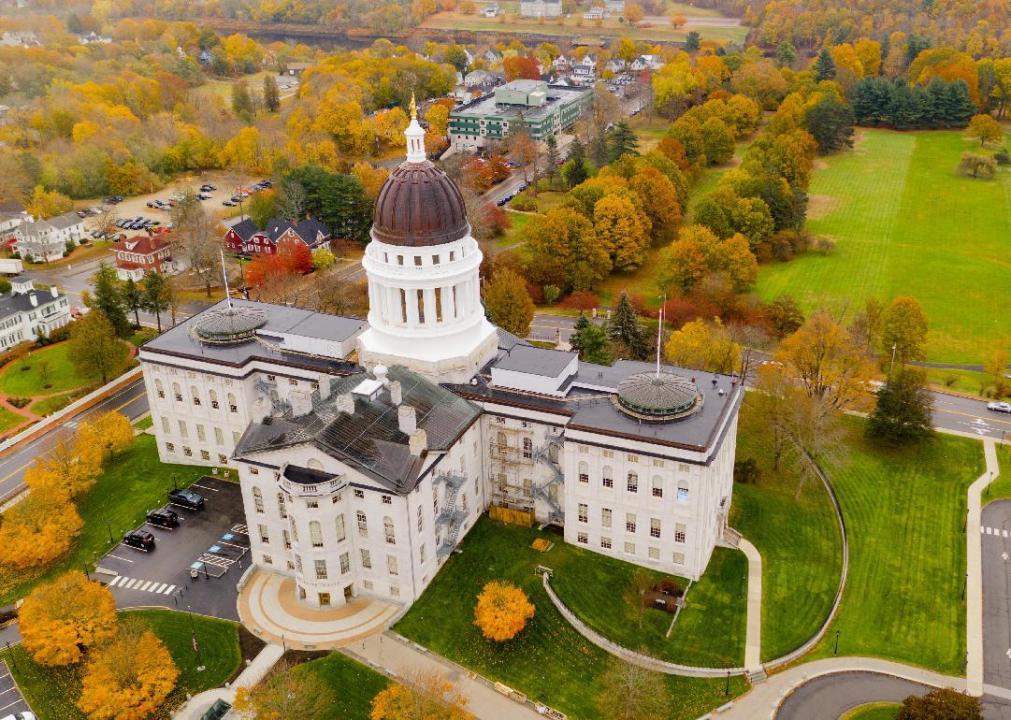
#15. Maine
– Members of unions: 70,000 (12.4% of employed population)
— Down 12,000 from 2020 (-2.3 percentage points)
– Workers represented by unions: 83,000 (14.7% of employed population)
— Down 10,000 from 2020 (-2.0 percentage points)
In 2017, Republican Gov. Paul LePage pushed to have Maine become the first Northeastern state to pass a right-to-work law. LePage argued that it was a necessary step to attract businesses, but his push was unsuccessful, the mixed state legislature balked, and in 2019, Maine elected a Democratic governor.

GoodFreePhotos
#14. Massachusetts
– Members of unions: 402,000 (12.6% of employed population)
— Up 45,000 from 2020 (+0.6 percentage points)
– Workers represented by unions: 433,000 (13.6% of employed population)
— Up 50,000 from 2020 (+0.8 percentage points)
Labor in Massachusetts flexed its muscles when the governor began devising reopening plans in May 2020, after the pandemic forced an economic shutdown in the state. Since union laborers comprised the majority of the front-line service workers who would be most affected, union leaders demanded a seat at the table of the committee tasked with crafting the reopening strategy.
Derek.cashman // Wikimedia Commons
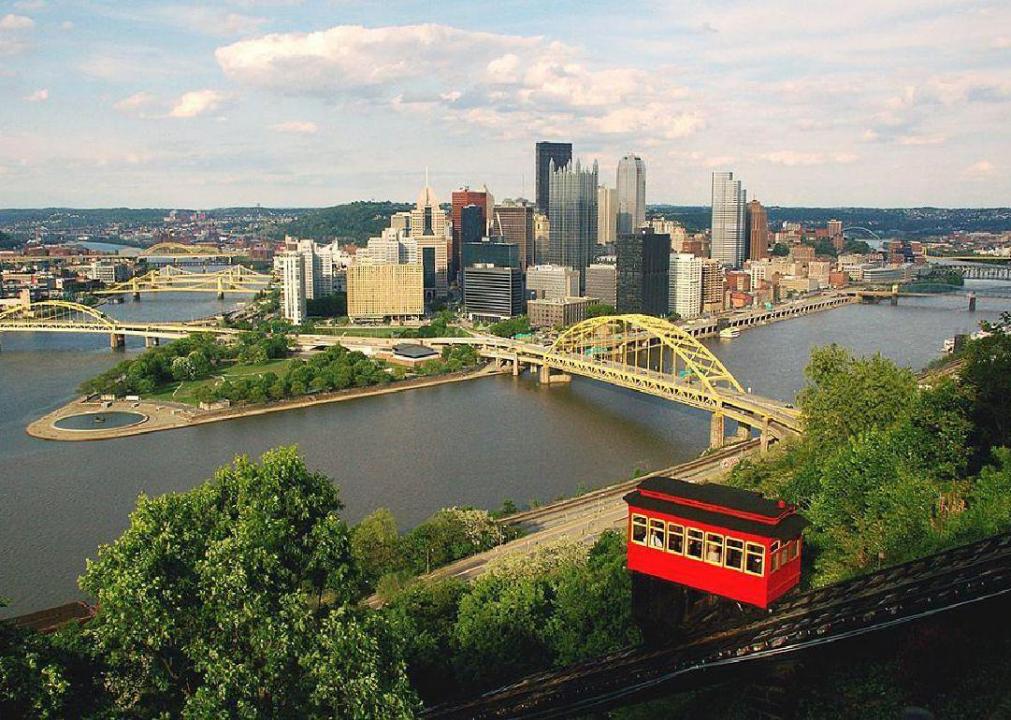
#13. Pennsylvania
– Members of unions: 693,000 (12.9% of employed population)
— Down 24,000 from 2020 (-0.6 percentage points)
– Workers represented by unions: 732,000 (13.6% of employed population)
— Down 43,000 from 2020 (-1.0 percentage point)
As an early leader in the mining, railroad, coal, and agriculture industries, Pennsylvania played a critical role in America’s formative organized labor movements. It’s not a right-to-work state, and starting in 1988, non-union, public-sector laborers who didn’t want to join or pay dues paid a reduced fee to be covered by union-earned collective bargaining agreements. Called the fair-share fee, this plan—and others like it all across America—was struck down by the Supreme Court in 2018 in a devastating decision against organized labor.
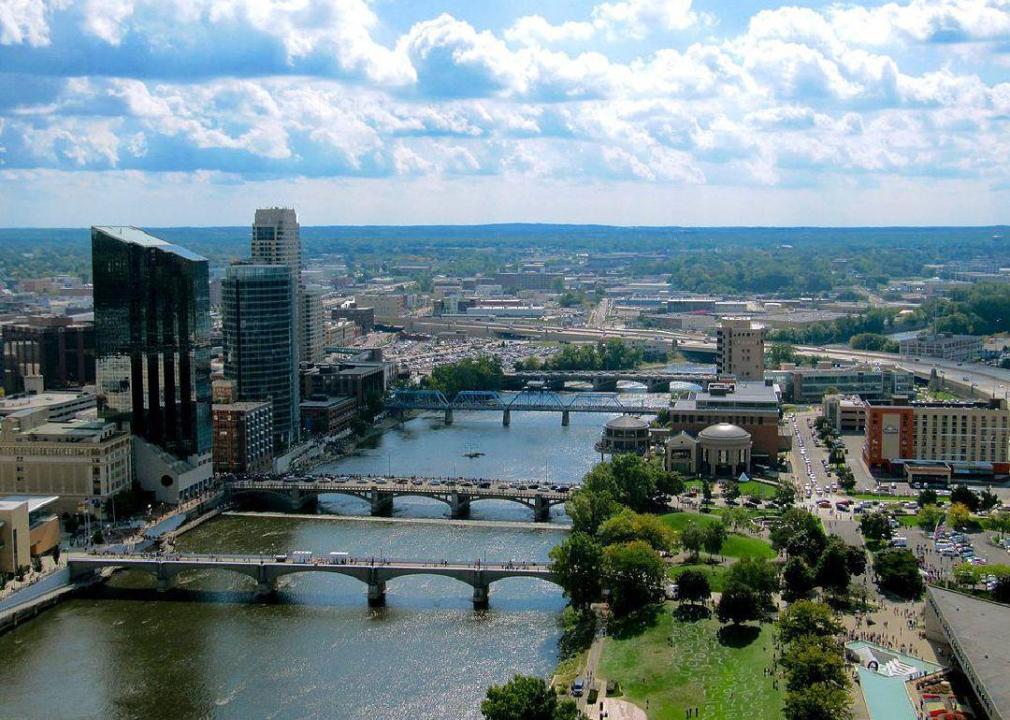
Rachel KRamer // Wikimedia Commons
#12. Michigan
– Members of unions: 540,000 (13.3% of employed population)
— Down 64,000 from 2020 (-1.9 percentage points)
– Workers represented by unions: 620,000 (15.3% of employed population)
— Down 41,000 from 2020 (-1.3 percentage points)
In 2012, Michigan shocked the country when it became the 24th state to pass a right-to-work law in what had long been the cultural, historical, and political heart of the American labor movement. In 2018, five years after the law went into effect, nine of Michigan’s 11 largest unions reported declines in membership and political spending.
You may also like: 30 times history has tanked the stock market
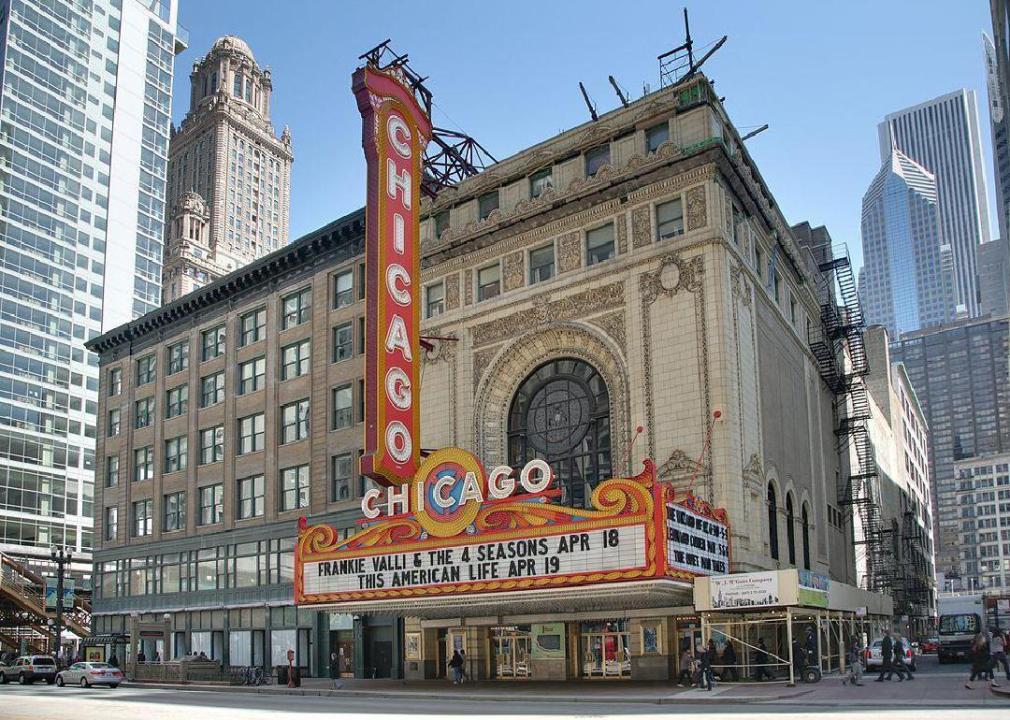
Daniel Schwen // Wikimedia Commons
#11. Illinois
– Members of unions: 752,000 (13.9% of employed population)
— Up 13,000 from 2020 (-0.4 percentage points)
– Workers represented by unions: 818,000 (15.2% of employed population)
— Up 30,000 from 2020 (no percentage point change)
The Pullman Strike, which led to the creation of Labor Day, took place in Illinois, home to the final resting place of Mother Jones. Some of the most important moments in the history of organized labor took place in Illinois as well, including the Cherry Mine Disaster, the Herrin Massacre, and the Haymarket Affair.
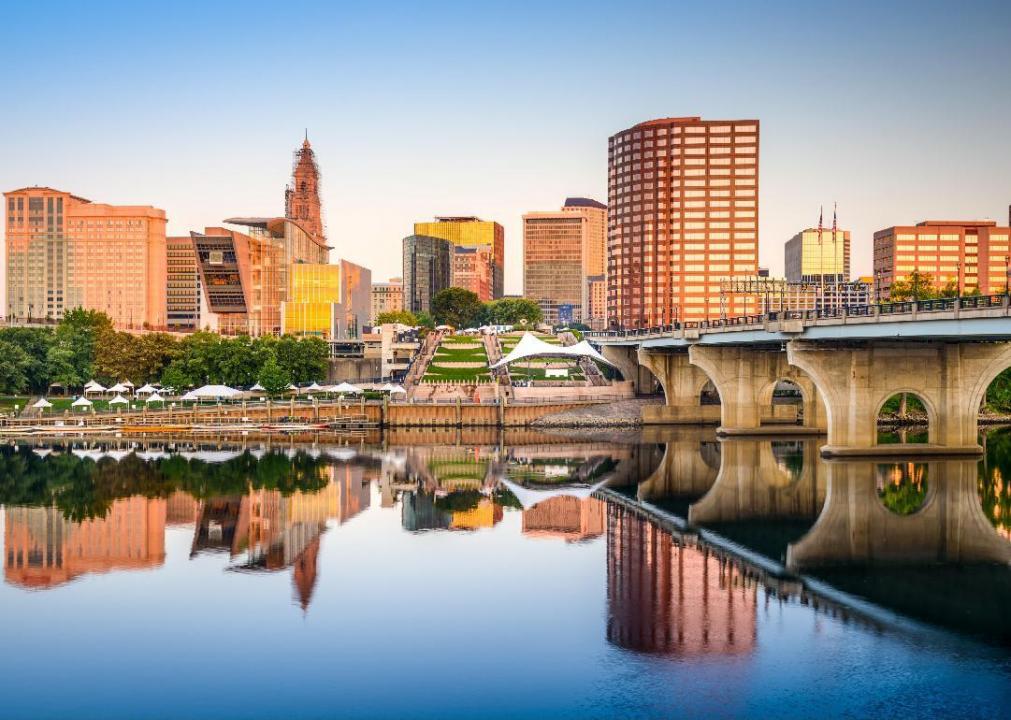
Sean Pavone // Shutterstock
#10. Connecticut
– Members of unions: 223,000 (14.6% of employed population)
— Down 39,000 from 2020 (-2.5 percentage points)
– Workers represented by unions: 248,000 (16.3% of employed population)
— Down 34,000 from 2020 (-2.1 percentage points)
Connecticut has recently been a battleground for the labor movement in the Northeast. In 2019, unions prevailed in two high-profile legislative battles, one that guaranteed a $15 minimum wage and another that granted paid medical leave. The state remains on the front lines of the region’s ongoing labor battles.
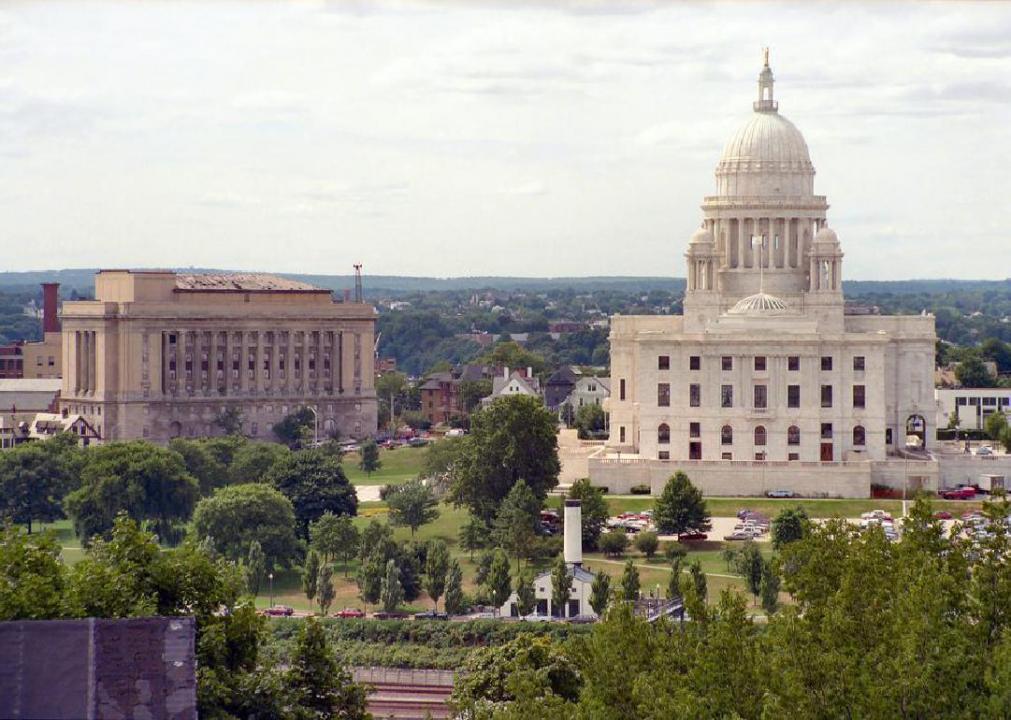
Will Hart // Flickr
#9. Rhode Island
– Members of unions: 75,000 (15.7% of employed population)
— Down 6,000 from 2020 (-2.1 percentage points)
– Workers represented by unions: 83,000 (17.4% of employed population)
— Down 4,000 from 2020 (-1.7 percentage points)
Although tiny in size, Rhode Island boasts one of America’s biggest union membership rolls in terms of the percentage of employee population—and it’s also home to some of organized labor’s oldest and richest history. The forerunners to Rhode Island’s first unions emerged in the early 1750s, before America was even a country.
Canva
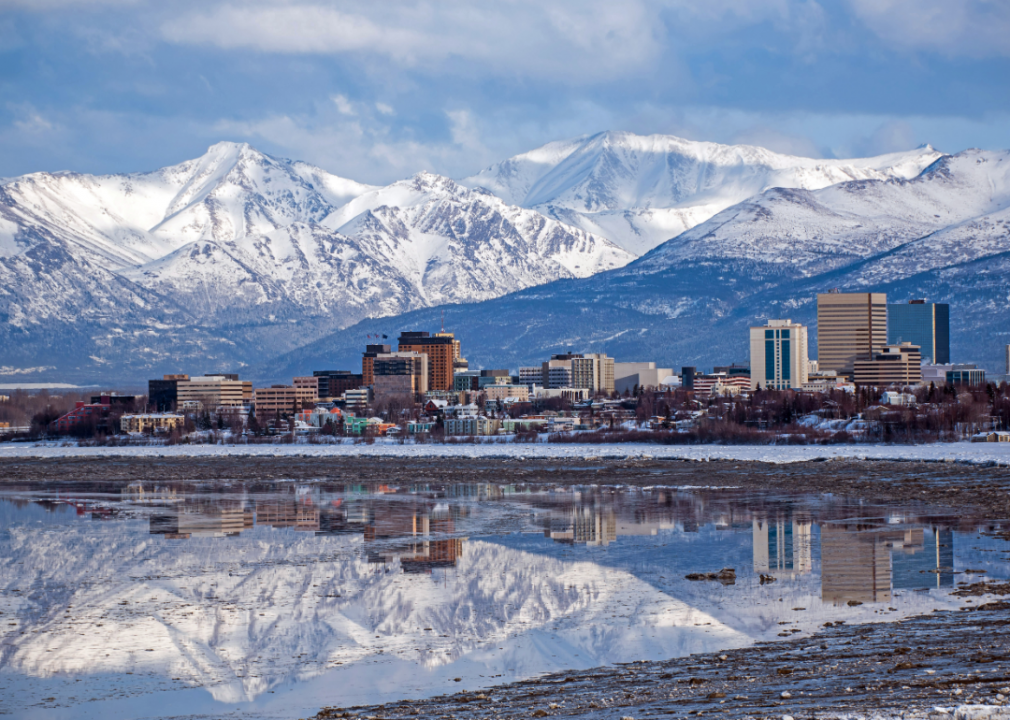
#8. Alaska
– Members of unions: 46,000 (15.8% of employed population)
— Down 3,000 from 2020 (-1.9 percentage points)
– Workers represented by unions: 50,000 (17.2% of employed population)
— Down 5,000 from 2020 (-2.3 percentage points)
Iowa’s recertification law is hardly the only example of anti-union legislators erecting unnecessary legal barriers making it harder to join a union, to recruit new union members, and to stay within the state’s regulations. In Alaska, for example—a state with a long history of labor solidarity—the governor pushed for a rule in 2019 that would force union workers to opt in to their unions every year.
Canva
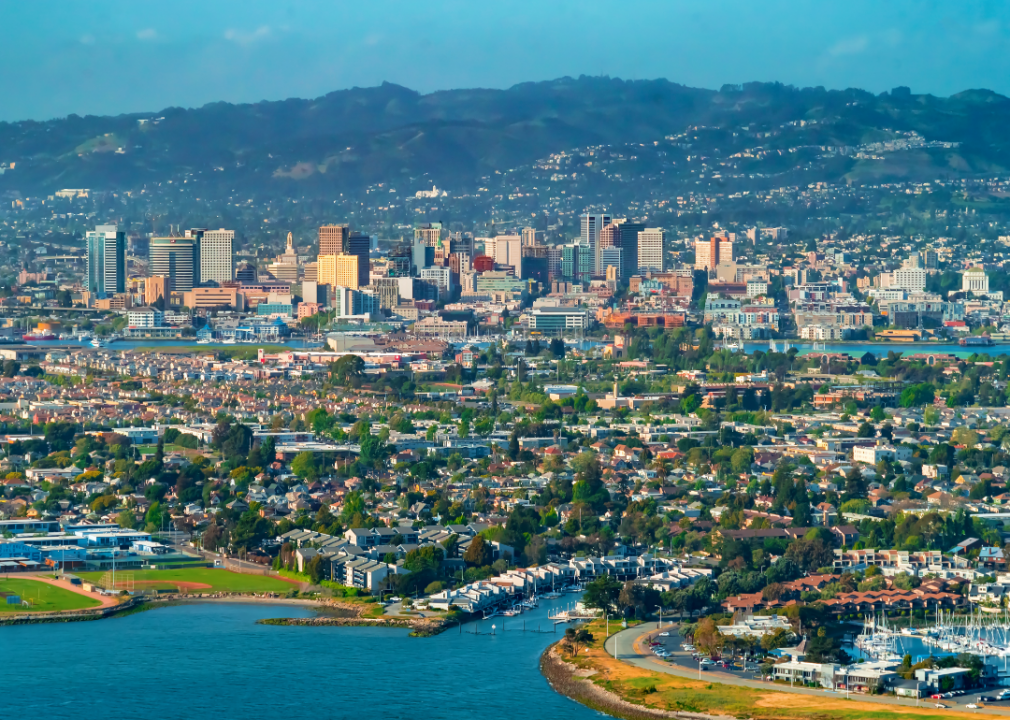
#7. California
– Members of unions: 2.5 million (15.9% of employed population)
— Up 27,000 from 2020 (-0.3 percentage points)
– Workers represented by unions: 2.8 million (17.8% of employed population)
— Up 102,000 from 2020 (+0.2 percentage points)
California is one of only two states in America that still measures its union members in the millions—and organized labor’s membership rolls in the Golden State continue to grow. After years of decline, unions in California realized gains among electricians, nurses, mechanics, researchers, animation artists, and more. This growth has been enabled by a labor-friendly state legislature.
You may also like: 30 of the biggest scams in modern history
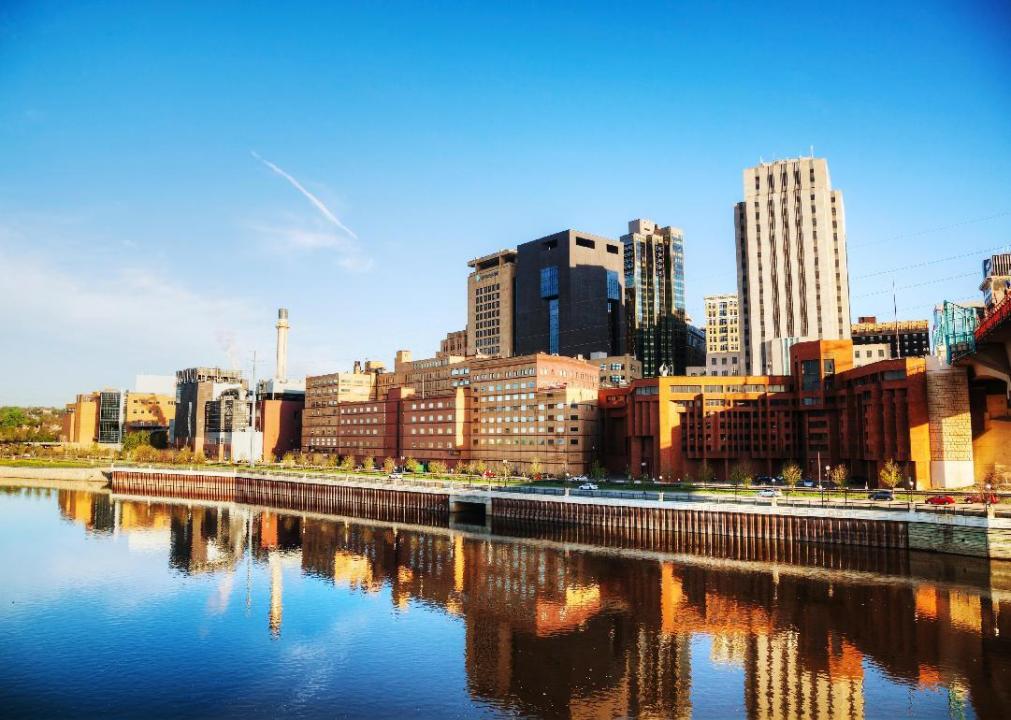
photo.ua // Shutterstock
#6. Minnesota
– Members of unions: 416,000 (16% of employed population)
— Up 18,000 from 2020 (+0.2 percentage points)
– Workers represented by unions: 446,000 (17.1% of employed population)
— Up 19,000 from 2020 (+0.1 percentage points)
Minnesota joins Ohio, Illinois, and Missouri as the only remaining states in the Midwest not governed by right-to-work laws. The state’s labor activists are famous for their intense political participation, and Minnesota union membership has increased as the state adds more and more jobs.

Public Domain
#5. New Jersey
– Members of unions: 608,000 (16.2% of employed population)
— Up 8,000 from 2020 (+0.1 percentage points)
– Workers represented by unions: 672,000 (17.9% of employed population)
— Up 12,000 from 2020 (+0.1 percentage points)
New Jersey is home to some of the oldest industrial centers, and its history in the labor movement goes back nearly as far as the industrial revolution. Shortly after the country won its independence, laborers in New Jersey’s massive shoemaking industry organized for better working conditions.
Canva
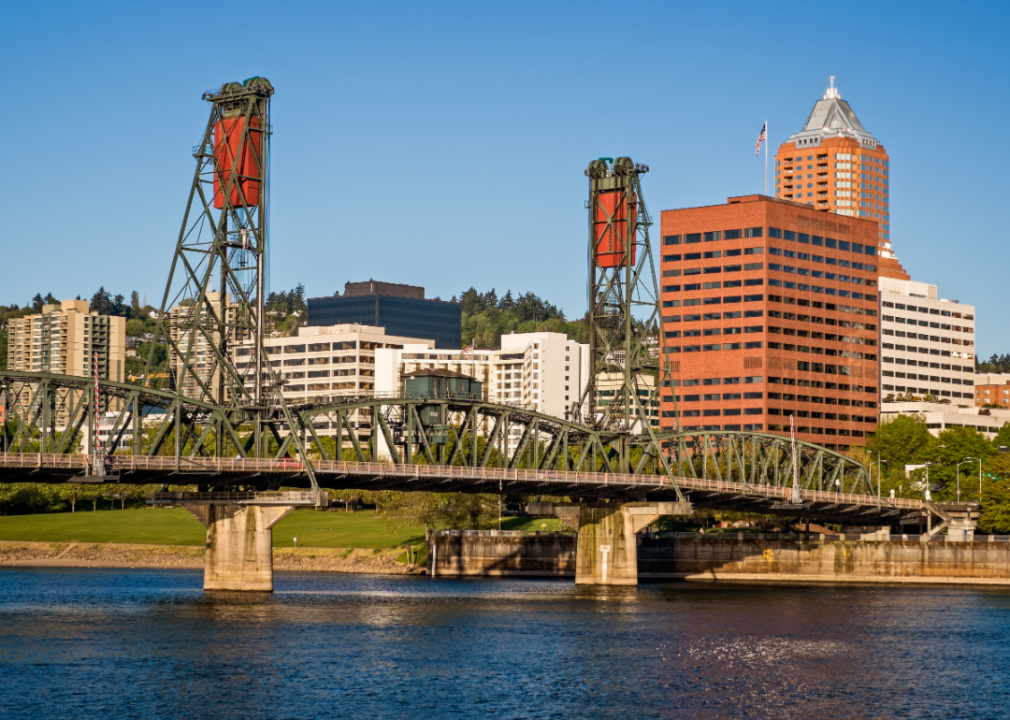
#4. Oregon
– Members of unions: 318,000 (17.8% of employed population)
— Up 43,000 from 2020 (+1.6 percentage points)
– Workers represented by unions: 336,000 (18.8% of employed population)
— Up 43,000 from 2020 (+1.5 percentage points)
Oregon is part of the organized labor stronghold that is the American West Coast. As union membership declined nationwide in 2019, membership rolls in Oregon went up. The downside, however, is that the influence of organized labor appears to have waned since the Supreme Court ruled in 2018 that non-union members can’t be forced to financially contribute to collective bargaining initiatives.
Oragne_Suede_Sofa // Wikimedia Commons
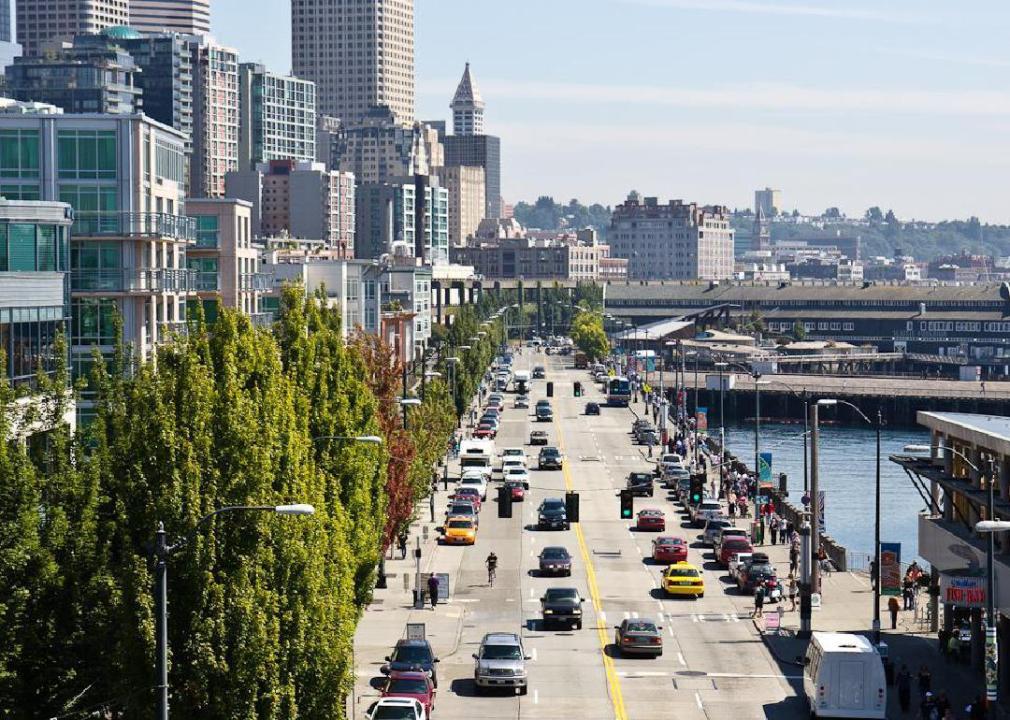
#3. Washington
– Members of unions: 629,000 (19% of employed population)
— Up 72,000 from 2020 (+1.6 percentage points)
– Workers represented by unions: 661,000 (20% of employed population)
— Up 65,000 from 2020 (+1.4 percentage points)
One of America’s most reliable labor strongholds, Washington state saw its membership rolls rise by more than 10% in 2019 as unions across the state added tens of thousands of new members. Among the modern legislative accomplishments attributed to union activism in Washington are a $15 minimum wage, paid sick leave, and paid medical and family leave.

Canva
#2. New York
– Members of unions: 1.7 million (22.2% of employed population)
— Up 68,000 from 2020 (+0.2 percentage points)
– Workers represented by unions: 1.9 million (24.1% of employed population)
— Up 85,000 from 2020 (+0.5 percentage points)
New York stands with California as the only two states left with seven-figure union membership rolls. From the Brooklyn Bridge and the Empire State Building, to the network of subterranean tunnels that carry millions of New Yorkers on the city’s subway system every day, the evidence of New York City’s industrial heritage is literally everywhere you look. But it’s not just the big city—unions have contributed to every facet of the labor, politics, and social fabric across the state.
You may also like: 30 big companies that started with little to no funding

Izabela23 // Shutterstock
#1. Hawaii
– Members of unions: 121,000 (22.4% of employed population)
— Up 1,000 from 2020 (-1.3 percentage points)
– Workers represented by unions: 131,000 (24.1% of employed population)
— Up 1,000 from 2020 (-1.6 percentage points)
Only two states can still boast union membership of more than 20% of their working population—New York and Hawaii. The island chain witnessed labor uprisings long before achieving statehood, which were largely organized by race among laborers toiling in what was then the state’s sugar plantation system. Once workers united and formed one single union, however, organized labor grew deep roots in the state, and Hawaii continues to be America’s foremost union state.
You may also like: Can you guess the company these real ‘Jeopardy!’ questions are about?


You walk into a fast-food restaurant on your lunch break. You don’t see a cashier but instead a self-service kiosk, a technology that is becoming the new norm in eateries across the country. The kiosks usually offer customers a menu to scroll through and pictures of meals and specials with prompts to select their food and submit their payment in one place.
Self-service kiosks are big business. In fact, the market for self-service products is expected to grow from a $40.3 billion market value in 2022 to $63 billion by 2027, according to a report from BCC Research. Consumers do have mixed opinions about the kiosks, but about 3 out of 5 surveyed consumers reported that they were likely to use self-service kiosks, according to the National Restaurant Association. The technology, while expensive, can boost businesses’ bottom lines in the long run.
Task Group summarized the rise in digital ordering over the past couple of years, its acceptance among customers, and a cost analysis of adopting the technology.
Self-service kiosks—digital machines or display booths—are generally placed in high-traffic areas. They can be used for different reasons, including navigating a store or promoting a product. Interactive self-service kiosks in particular are meant for consumers to place orders with little to no assistance from employees.
The idea of kiosks isn’t new. The concept of self-service was first introduced in the 1880s when the first types of kiosks appeared as vending machines selling items like gum and postcards. In the present age of technology, the trend of self-service has only grown. Restaurants such as McDonald’s and Starbucks have already tried out cashierless technology.
From a business perspective, the kiosks offer a huge upside. While many employers are looking for workers, they’re having a hard time finding staff. In the midst of the COVID-19 pandemic, employers struggled with a severe employee shortage. Since then, the problem has continued. In 2022, the National Restaurant Association reported that 65% of restaurant operators didn’t have enough workers on staff to meet consumer demand. With labor shortages running rampant, cashierless technology could help restaurants fill in for the lack of human employees.
The initial investment for the kiosks can be high. The general cost per kiosk is difficult to quantify, with one manufacturer estimating a range of $1,500 to $20,000 per station. However, with the use of kiosks, restaurants may not need as many cashiers or front-end employees, instead reallocating workers’ time to other tasks.
In May 2022, the hourly mean wage for cashiers who worked in restaurants and other eating establishments was $12.99, according to the Bureau of Labor Statistics. Kiosks could cost less money than a cashier in the long run.
But how do the customers themselves feel about the growing trend? According to a Deloitte survey, 62% of respondents report that they were “somewhat likely” to order from a cashierless restaurant if given the chance to do so. The same survey reported that only 19% of respondents had experience with a cashierless restaurant.
What would it mean for society if restaurants did decide to go completely cashierless? Well, millions of positions would likely no longer be necessary. One report suggests 82% of restaurant positions could be replaced by robots, a prospect making automation appealing to owners who can’t find staff to hire.
Due to the ongoing labor shortage, employers have tried raising employee wages. Papa John’s, Texas Roadhouse, and Chipotle were among the restaurant companies that increased employee pay or offered bonuses in an attempt to hire and retain more workers. Meanwhile, some companies have decided to use technology to perform those jobs instead, so that they wouldn’t have to put effort into hiring or focus their existing staff on other roles.
Story editing by Ashleigh Graf and Jeff Inglis. Copy editing by Tim Bruns.
![]()

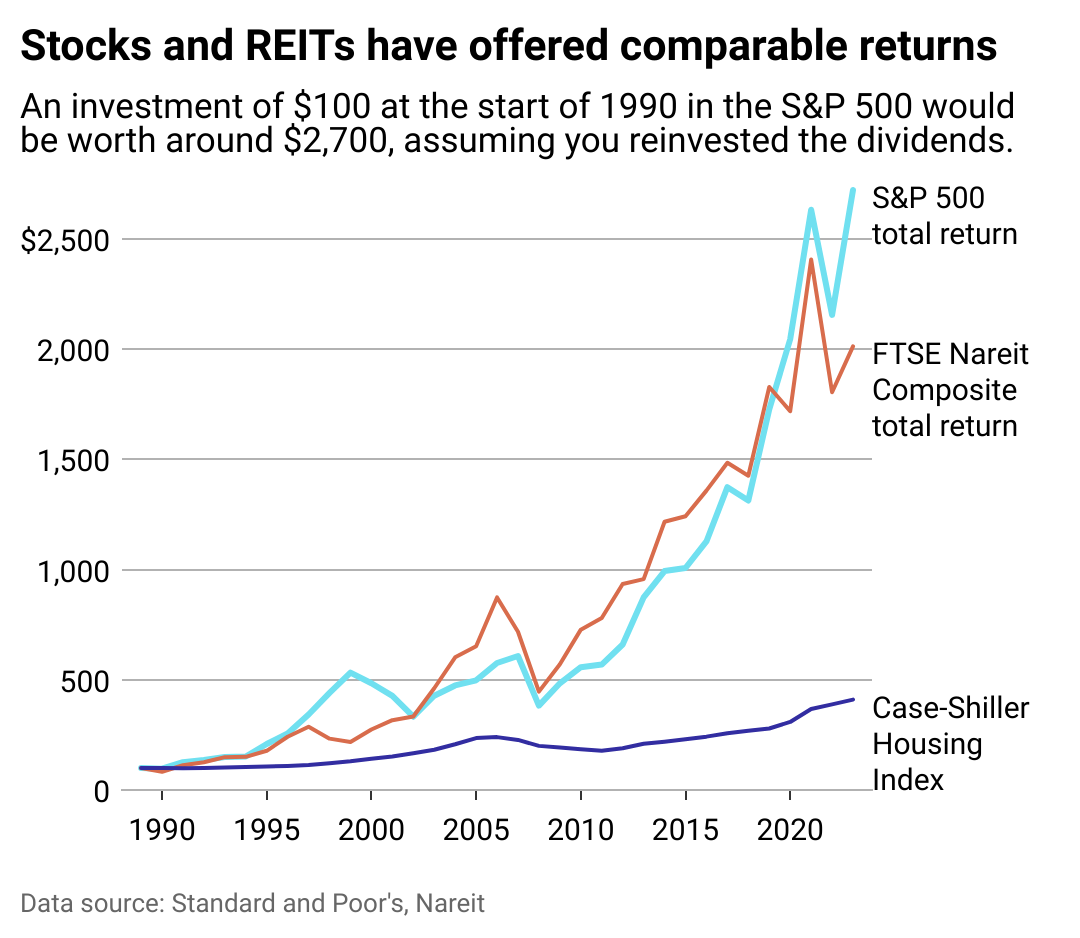
It’s well-documented that the surest, and often best, return on investments comes from playing the long game. But between stocks and real estate, which is the stronger bet?
To find out, financial planning firm Wealth Enhancement Group analyzed data from academic research, Standard and Poor’s, and Nareit to see how real estate compares to stocks as an investment.
Data going back to 1870 shows the well-established power of real estate as a powerful “long-run investment.” From 1870-2015, and after adjusting for inflation, real estate produced an average annual return of 7.05%, compared to 6.89% for equities. These findings, published in the 2019 issue of The Quarterly Journal of Economics, illustrate that stocks can deviate as much as 22% from their average, while housing only spreads out 10%. That’s because despite having comparable returns, stocks are inherently more volatile due to following the whims of the business cycle.
Real estate has inherent benefits, from unlocking cash flow and offering tax breaks to building equity and protecting investors from inflation. Investments here also help to diversify a portfolio, whether via physical properties or a real estate investment trust. Investors can track markets with standard resources that include the S&P CoreLogic Case-Shiller Home Price Indices, which tracks residential real estate prices; the Nareit U.S. Real Estate Index, which gathers data on the real estate investment trust, or REIT, industry; and the S&P 500, which tracks the stocks of 500 of the largest companies in the U.S.
High interest rates and a competitive market dampened the flurry of real-estate investments made in the last four years. The rise in interest rates equates to a bigger borrowing cost for investors, which can spell big reductions in profit margins. That, combined with the risk of high vacancies, difficult tenants, or hidden structural problems, can make real estate investing a less attractive option—especially for first-time investors.
Keep reading to learn more about whether real estate is a good investment today and how it stacks up against the stock market.
![]()
Wealth Enhancement Group
Stocks and housing have both done well
REITs can offer investors the stability of real estate returns without bidding wars or hefty down payments. A hybrid model of stocks and real estate, REITs allow the average person to invest in businesses that finance or own income-generating properties.
REITs delivered slightly better returns than the S&P 500 over the past 20-, 25-, and 50-year blocks. However, in the short term—the last 10 years, for instance—stocks outperformed REITs with a 12% return versus 9.5%, according to data compiled by The Motley Fool investor publication.
Whether a new normal is emerging that stocks will continue to offer higher REITs remains to be seen.
This year, the S&P 500 reached an all-time high, courtesy of investor enthusiasm in speculative tech such as artificial intelligence. However, just seven tech companies, dubbed “The Magnificent 7,” are responsible for an outsized amount of the S&P’s returns last year, creating worry that there may be a tech bubble.
While indexes keep a pulse on investment performance, they don’t always tell the whole story. The Case-Shiller Index only measures housing prices, for example, which leaves out rental income (profit) or maintenance costs (loss) when calculating the return on residential real estate investment.
Wealth Enhancement Group
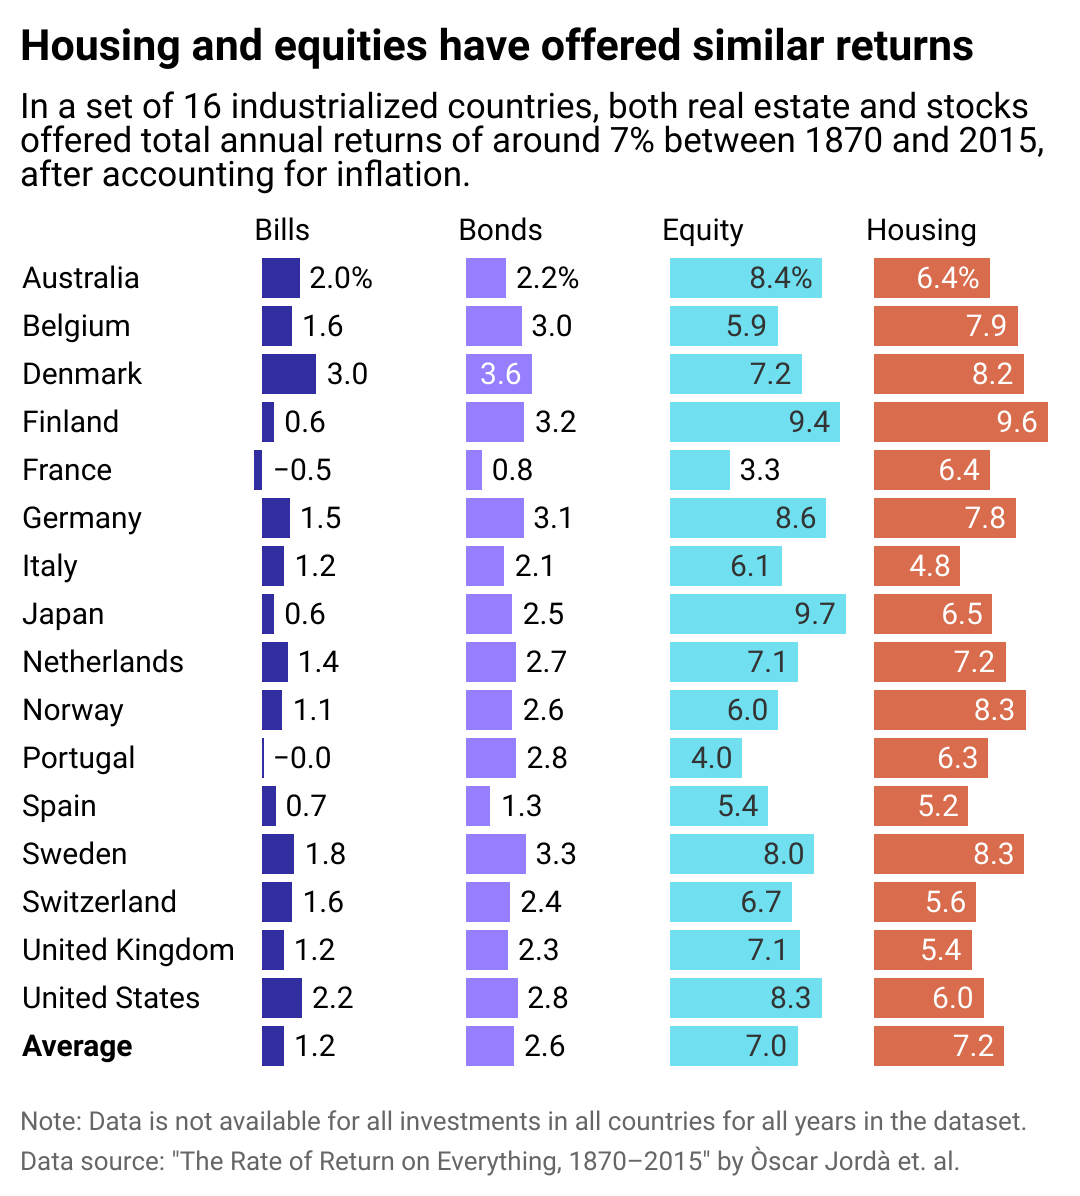
Housing returns have been strong globally too
Like its American peers, the global real estate market in industrialized nations offers comparable returns to the international stock market.
Over the long term, returns on stocks in industrialized nations is 7%, including dividends, and 7.2% in global real estate, including rental income some investors receive from properties. Investing internationally may have more risk for American buyers, who are less likely to know local rules and regulations in foreign countries; however, global markets may offer opportunities for a higher return. For instance, Portugal’s real estate market is booming due to international visitors deciding to move there for a better quality of life. Portugal’s housing offers a 6.3% return in the long term, versus only 4.3% for its stock market.
For those with deep enough pockets to stay in, investing in housing will almost always bear out as long as the buyer has enough equity to manage unforeseen expenses and wait out vacancies or slumps in the market. Real estate promises to appreciate over the long term, offers an opportunity to collect rent for income, and allows investors to leverage borrowed capital to increase additional returns on investment.
Above all, though, the diversification of assets is the surest way to guarantee a strong return on investments. Spreading investments across different assets increases potential returns and mitigates risk.
Story editing by Nicole Caldwell. Copy editing by Paris Close. Photo selection by Lacy Kerrick.
This story originally appeared on Wealth Enhancement Group and was produced and
distributed in partnership with Stacker Studio.

In today’s digital climate, consuming sports has never been easier. Thanks to a plethora of streaming sites, alternative broadcasts, and advancements to home entertainment systems, the average fan has myriad options to watch and learn about their favorite teams at the touch of a button—all without ever having to leave the couch.
As a result, more and more sports venues have committed to improving and modernizing their facilities and fan experiences to compete with at-home audiences. Consider using mobile ticketing and parking passes, self-service kiosks for entry and ordering food, enhanced video boards, and jumbotrons that supply data analytics and high-definition replays. These innovations and upgrades are meant to draw more revenue and attract various sponsored partners. They also deliver unique and convenient in-person experiences that rival and outmatch traditional ways of enjoying games.
In Los Angeles, the Rams and Chargers’ SoFi Stadium has become the gold standard for football venues. It’s an architectural wonder with closer views, enhanced hospitality, and a translucent roof that cools the stadium’s internal temperature.
The Texas Rangers’ ballpark, Globe Life Field, added field-level suites and lounges that resemble the look and feel of a sports bar. Meanwhile, the Los Angeles Clippers are building a new arena (in addition to retail space, team offices, and an outdoor public plaza) that will seat 18,000 people and feature a fan section called The Wall, which will regulate attire and rooting interest.
It’s no longer acceptable to operate with old-school facilities and technology. Just look at Commanders Field (formerly FedExField), home of the Washington Commanders, which has faced criticism for its faulty barriers, leaking ceilings, poor food options, and long lines. Understandably, the team has been attempting to find a new location to build a state-of-the-art stadium and keep up with the demand for high-end amenities.
As more organizations audit their stadiums and arenas and keep up with technological innovations, Uniqode compiled a list of the latest tech advancements to coax—and keep—fans inside venues.
![]()
Jeff Gritchen/MediaNews Group/Orange County Register // Getty Images
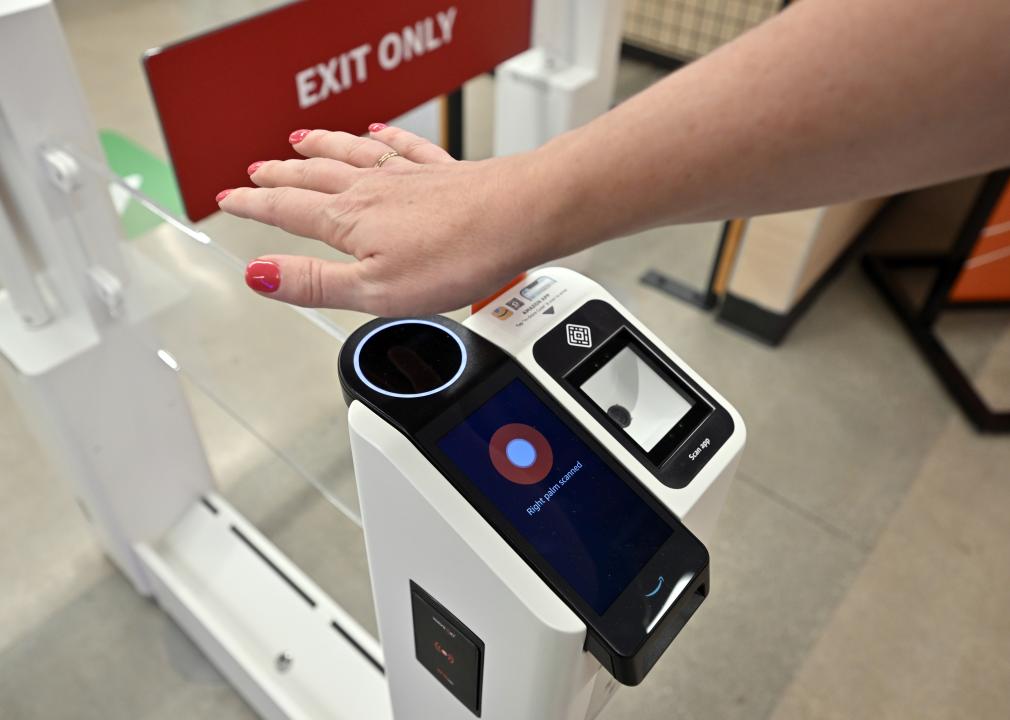
Just Walk Out technology
After successfully installing its first cashierless grocery store in 2020, Amazon has continued to put its tracking technology into practice.
In 2023, the Seahawks incorporated Just Walk Out technology at various merchandise stores throughout Lumen Field, allowing fans to purchase items with a swipe and scan of their palms.
The radio-frequency identification system, which involves overhead cameras and computer vision, is a substitute for cashiers and eliminates long lines.
RFID is now found in a handful of stadiums and arenas nationwide. These stores have already curbed checkout wait times, eliminated theft, and freed up workers to assist shoppers, according to Jon Jenkins, vice president of Just Walk Out tech.

Billie Weiss/Boston Red Sox // Getty Images
Self-serve kiosks
In the same vein as Amazon’s self-scanning technology, self-serve kiosks have become a more integrated part of professional stadiums and arenas over the last few years. Some of these function as top-tier vending machines with canned beers and nonalcoholic drinks, shuffling lines quicker with virtual bartenders capable of spinning cocktails and mixed drinks.
The kiosks extend past beverages, as many college and professional venues have started using them to scan printed and digital tickets for more efficient entrance. It’s an effort to cut down lines and limit the more tedious aspects of in-person attendance, and it’s led various competing kiosk brands to provide their specific conveniences.

Kyle Rivas // Getty Images
Mobile ordering
Is there anything worse than navigating the concourse for food and alcohol and subsequently missing a go-ahead home run, clutch double play, or diving catch?
Within the last few years, more stadiums have eliminated those worries thanks to contactless mobile ordering. Fans can select food and drink items online on their phones to be delivered right to their seats. Nearly half of consumers said mobile app ordering would influence them to make more restaurant purchases, according to a 2020 study at PYMNTS. Another study showed a 22% increase in order size.
Many venues, including Yankee Stadium, have taken notice and now offer personalized deliveries in certain sections and established mobile order pick-up zones throughout the ballpark.

Darrian Traynor // Getty Images
QR codes at seats
Need to remember a player’s name? Want to look up an opponent’s statistics at halftime? The team at Digital Seat Media has you covered.
Thus far, the company has added seat tags to more than 50 venues—including two NFL stadiums—with QR codes to promote more engagement with the product on the field. After scanning the code, fans can access augmented reality features, look up rosters and scores, participate in sponsorship integrations, and answer fan polls on the mobile platform.

Boris Streubel/Getty Images for DFL // Getty Images
Real-time data analytics and generative AI
As more venues look to reinvigorate the in-stadium experience, some have started using generative artificial intelligence and real-time data analytics. Though not used widely yet, generative AI tools can create new content—text, imagery, or music—in conjunction with the game, providing updates, instant replays, and location-based dining suggestions
Last year, the Masters golf tournament even began including AI score projections in its mobile app. Real-time data is streamlining various stadium pitfalls, allowing operation managers to monitor staffing issues at busy food spots, adjust parking flows, and alert custodians to dirty or damaged bathrooms. The data also helps with security measures. Open up an app at a venue like the Honda Center in Anaheim, California, and report safety issues or belligerent fans to help better target disruptions and preserve an enjoyable experience.
Story editing by Nicole Caldwell. Copy editing by Paris Close. Photo selection by Lacy Kerrick.
This story originally appeared on Uniqode and was produced and
distributed in partnership with Stacker Studio.
-

 Business5 months ago
Skill-based hiring is the answer to labour shortages, BCG report finds
-

 Events4 months ago
The Northern Lights Technology & Innovation Forum comes to Calgary next month
-

 Business5 months ago
mesh conference goes deep on AI, with experts focusing in on training, ethics, and risk
-

 People5 months ago
How connected technologies trim rework and boost worker safety in hands-on industries
-

 Events5 months ago
COP28 points to AI for climate change solutions in developing countries